ESC
Cellular Assays

Cellular & Functional Assay Development

I design and execute a broad range of cellular assays — from live-cell imaging and receptor-ligand binding to flow cytometry and immune-target co-cultures — to uncover disease mechanisms and generate decision-enabling datasets for preclinical programs.

Live-Cell Imaging Endocytosis Exosomal Biology Flow Cytometry PBMC / Immune Assays Autophagy & Mitophagy Plate-Based Readouts Immunocytochemistry
01

Live-Cell Imaging & Organelle Dynamics

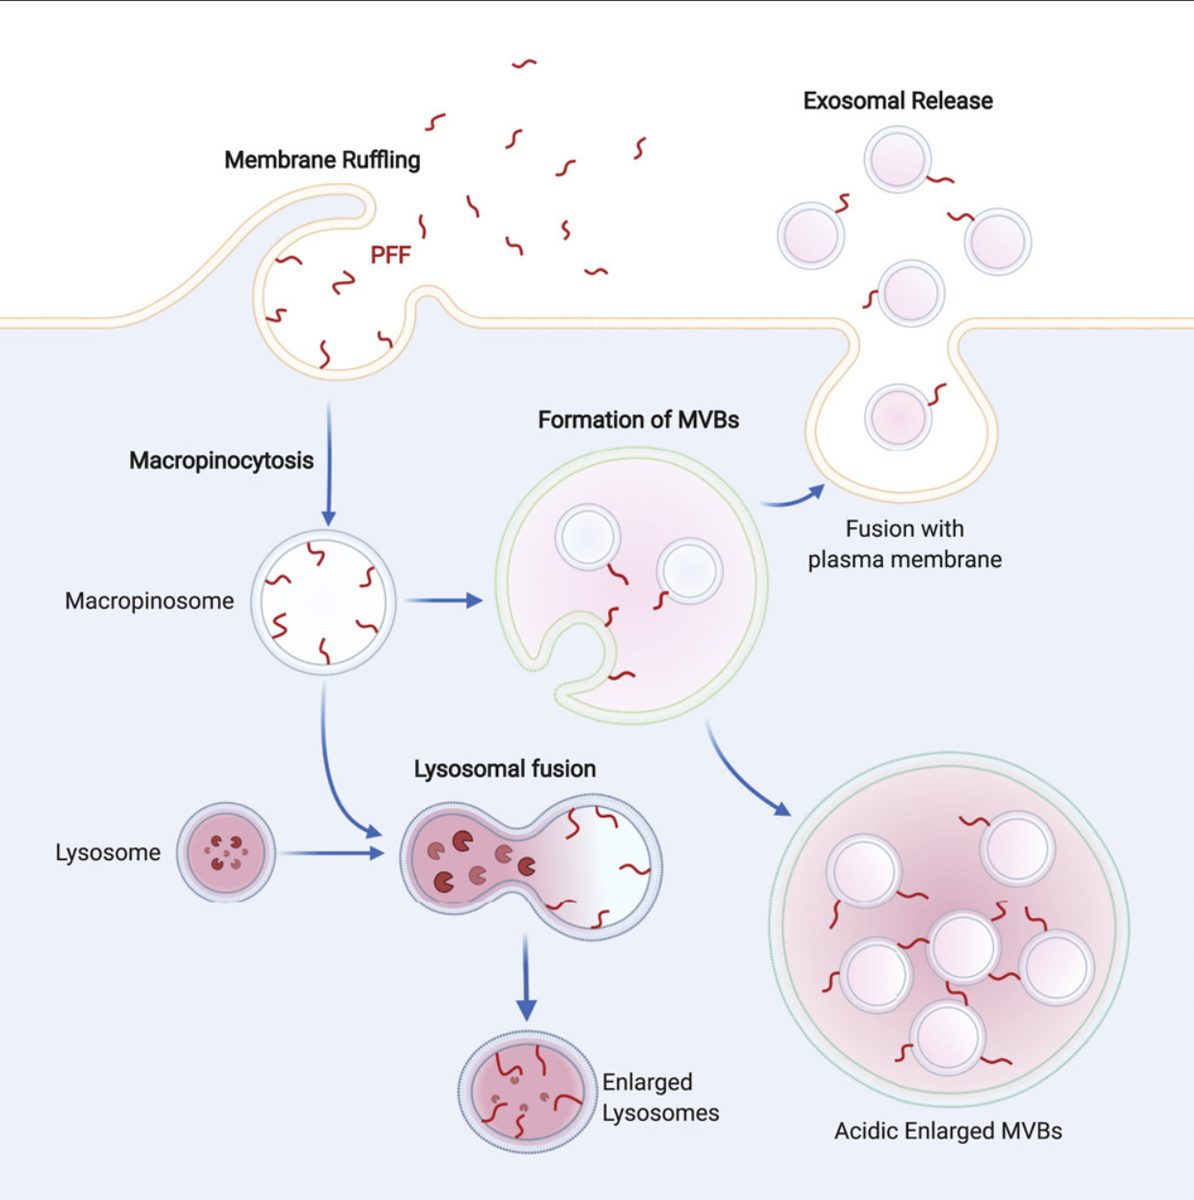
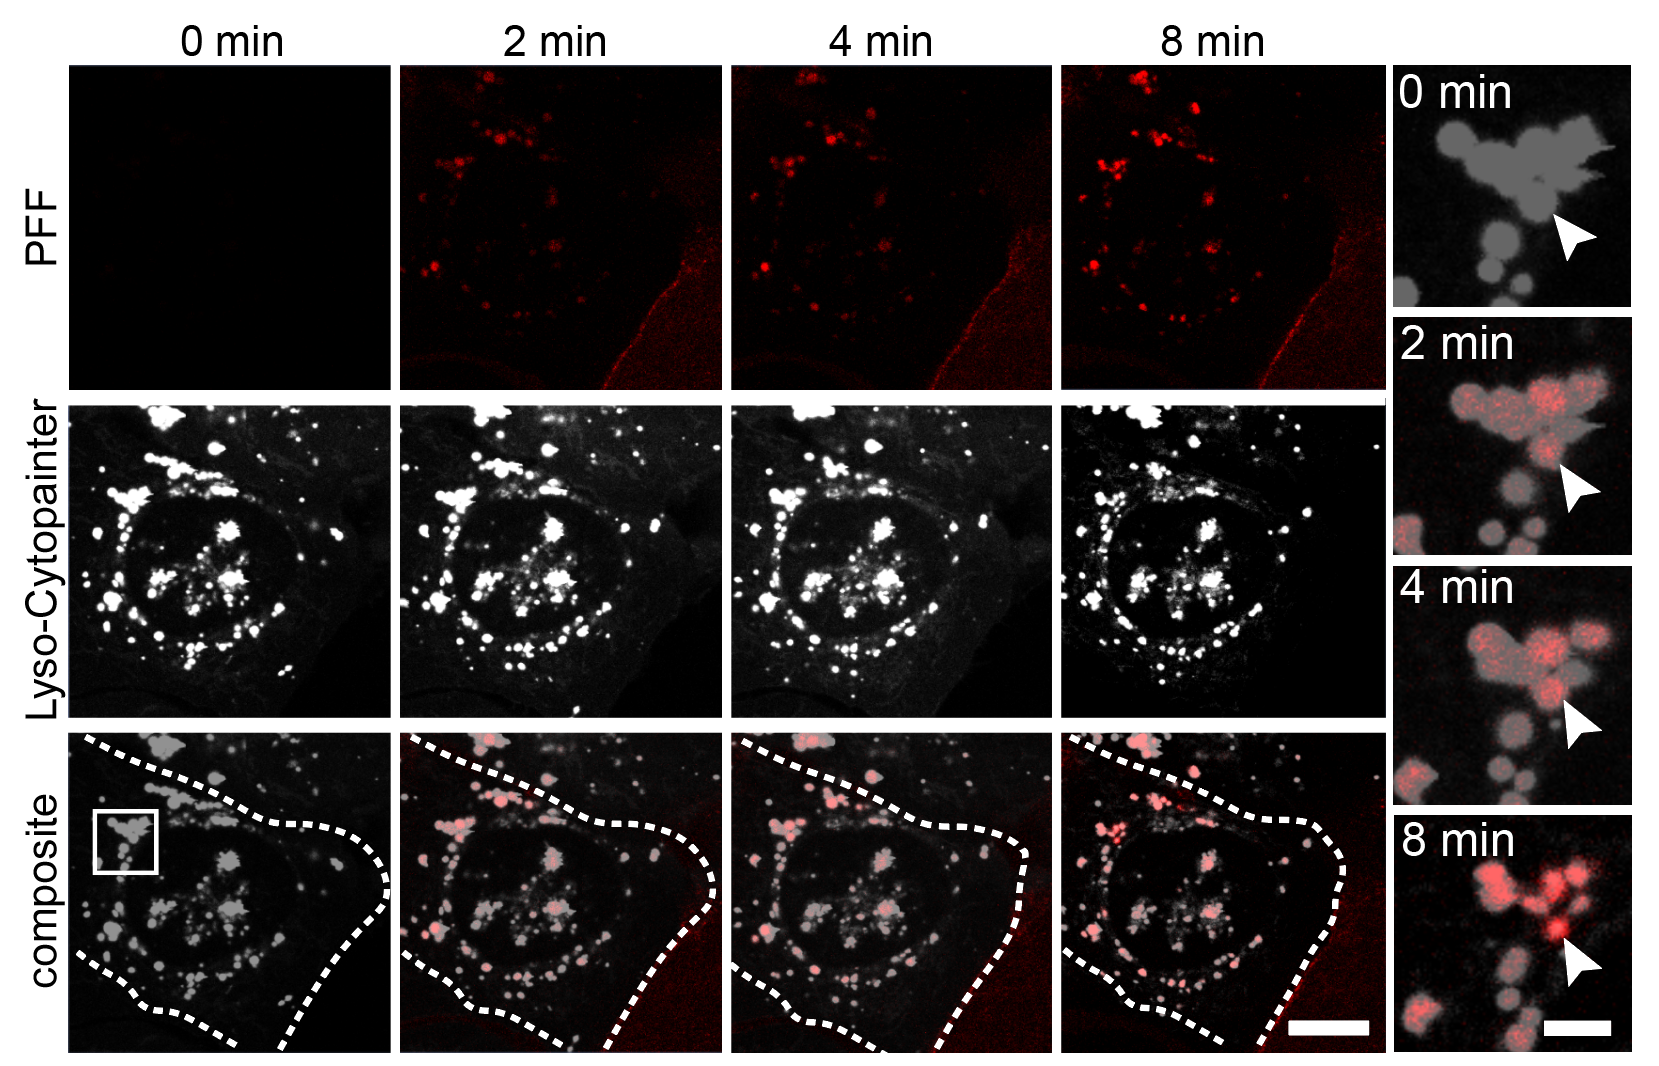
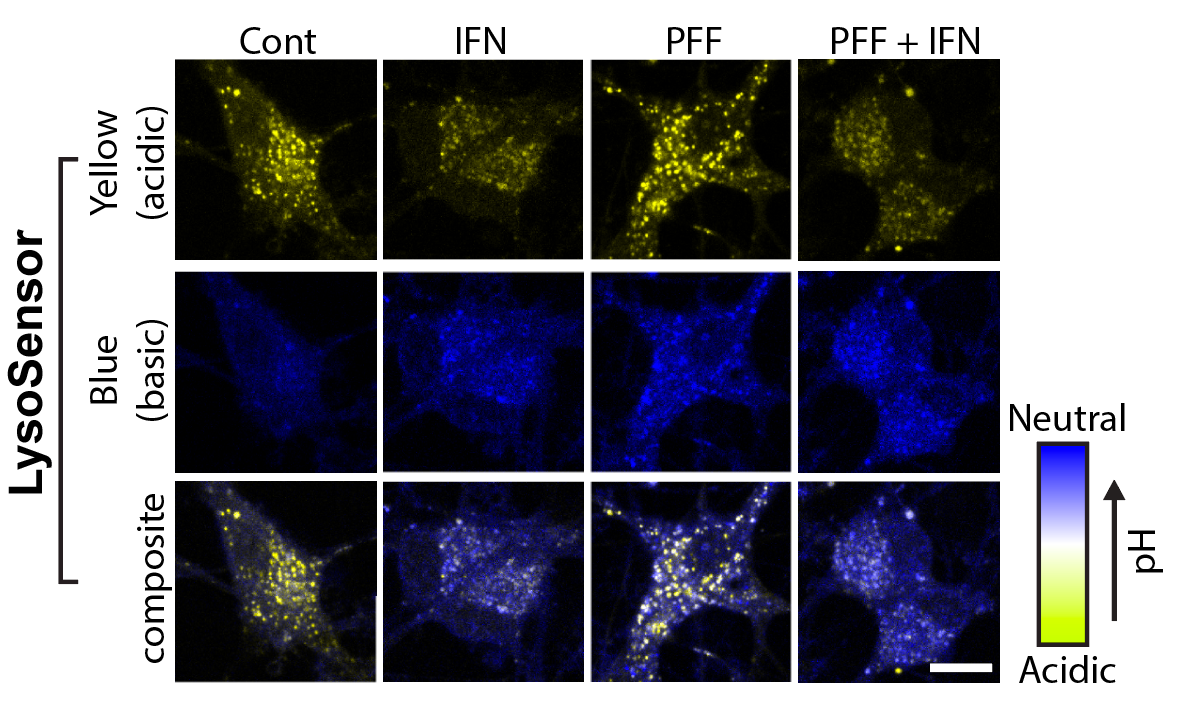
I track mitochondrial clearance, Parkin translocation, lysosomal pH, and organelle fusion in real time using live-cell confocal microscopy. Assays include LysoSensor/LysoTracker staining for lysosomal integrity, MitoTracker for mitochondrial morphology, and calcium imaging for neuronal activity. GBA KO neurons display unique comet-like lysosomal morphology only visible in live recordings.

LC3B and PFF confocal time course (Day 2-21): PFF only vs PFF+IFN-gamma showing progressive autophagy impairment
Confocal time-course (Day 2–21) of LC3B puncta (autophagy marker) showing progressive impairment under PFF + IFN-γ dual-hit vs PFF-only control.

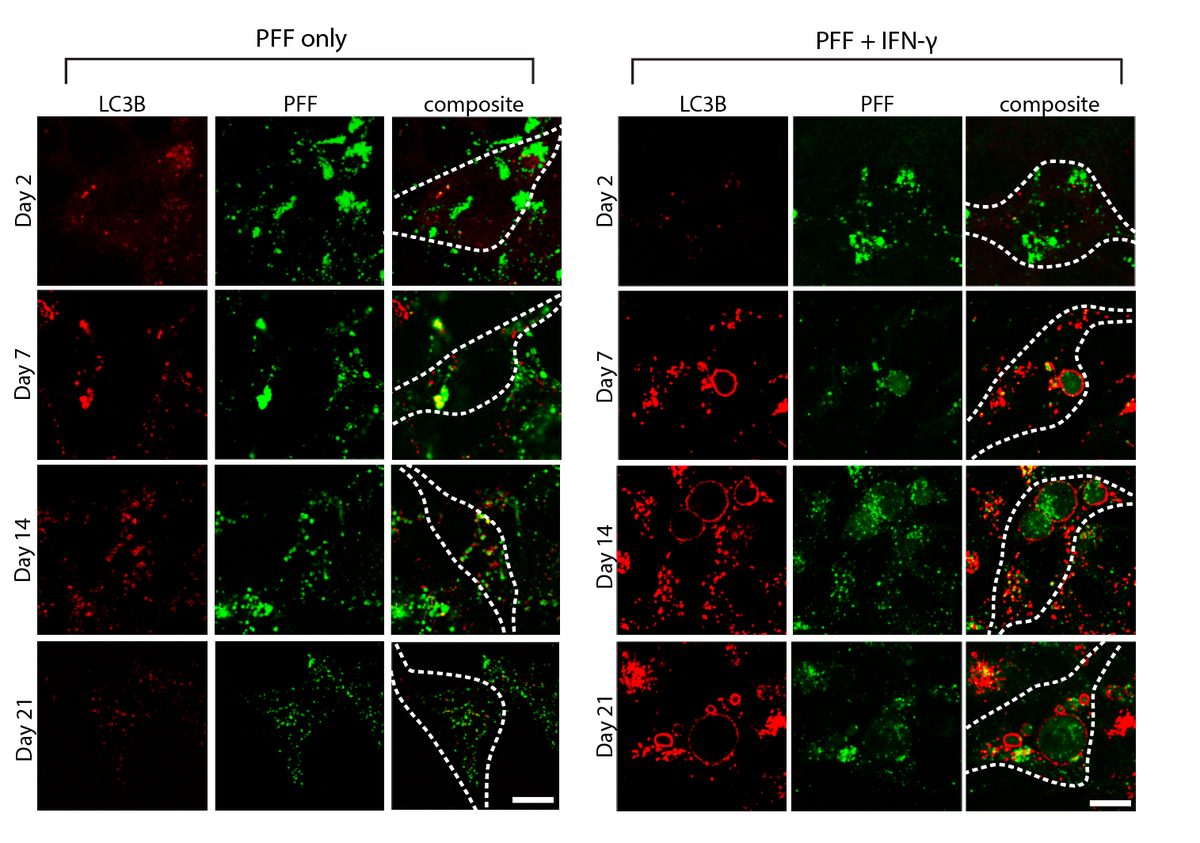
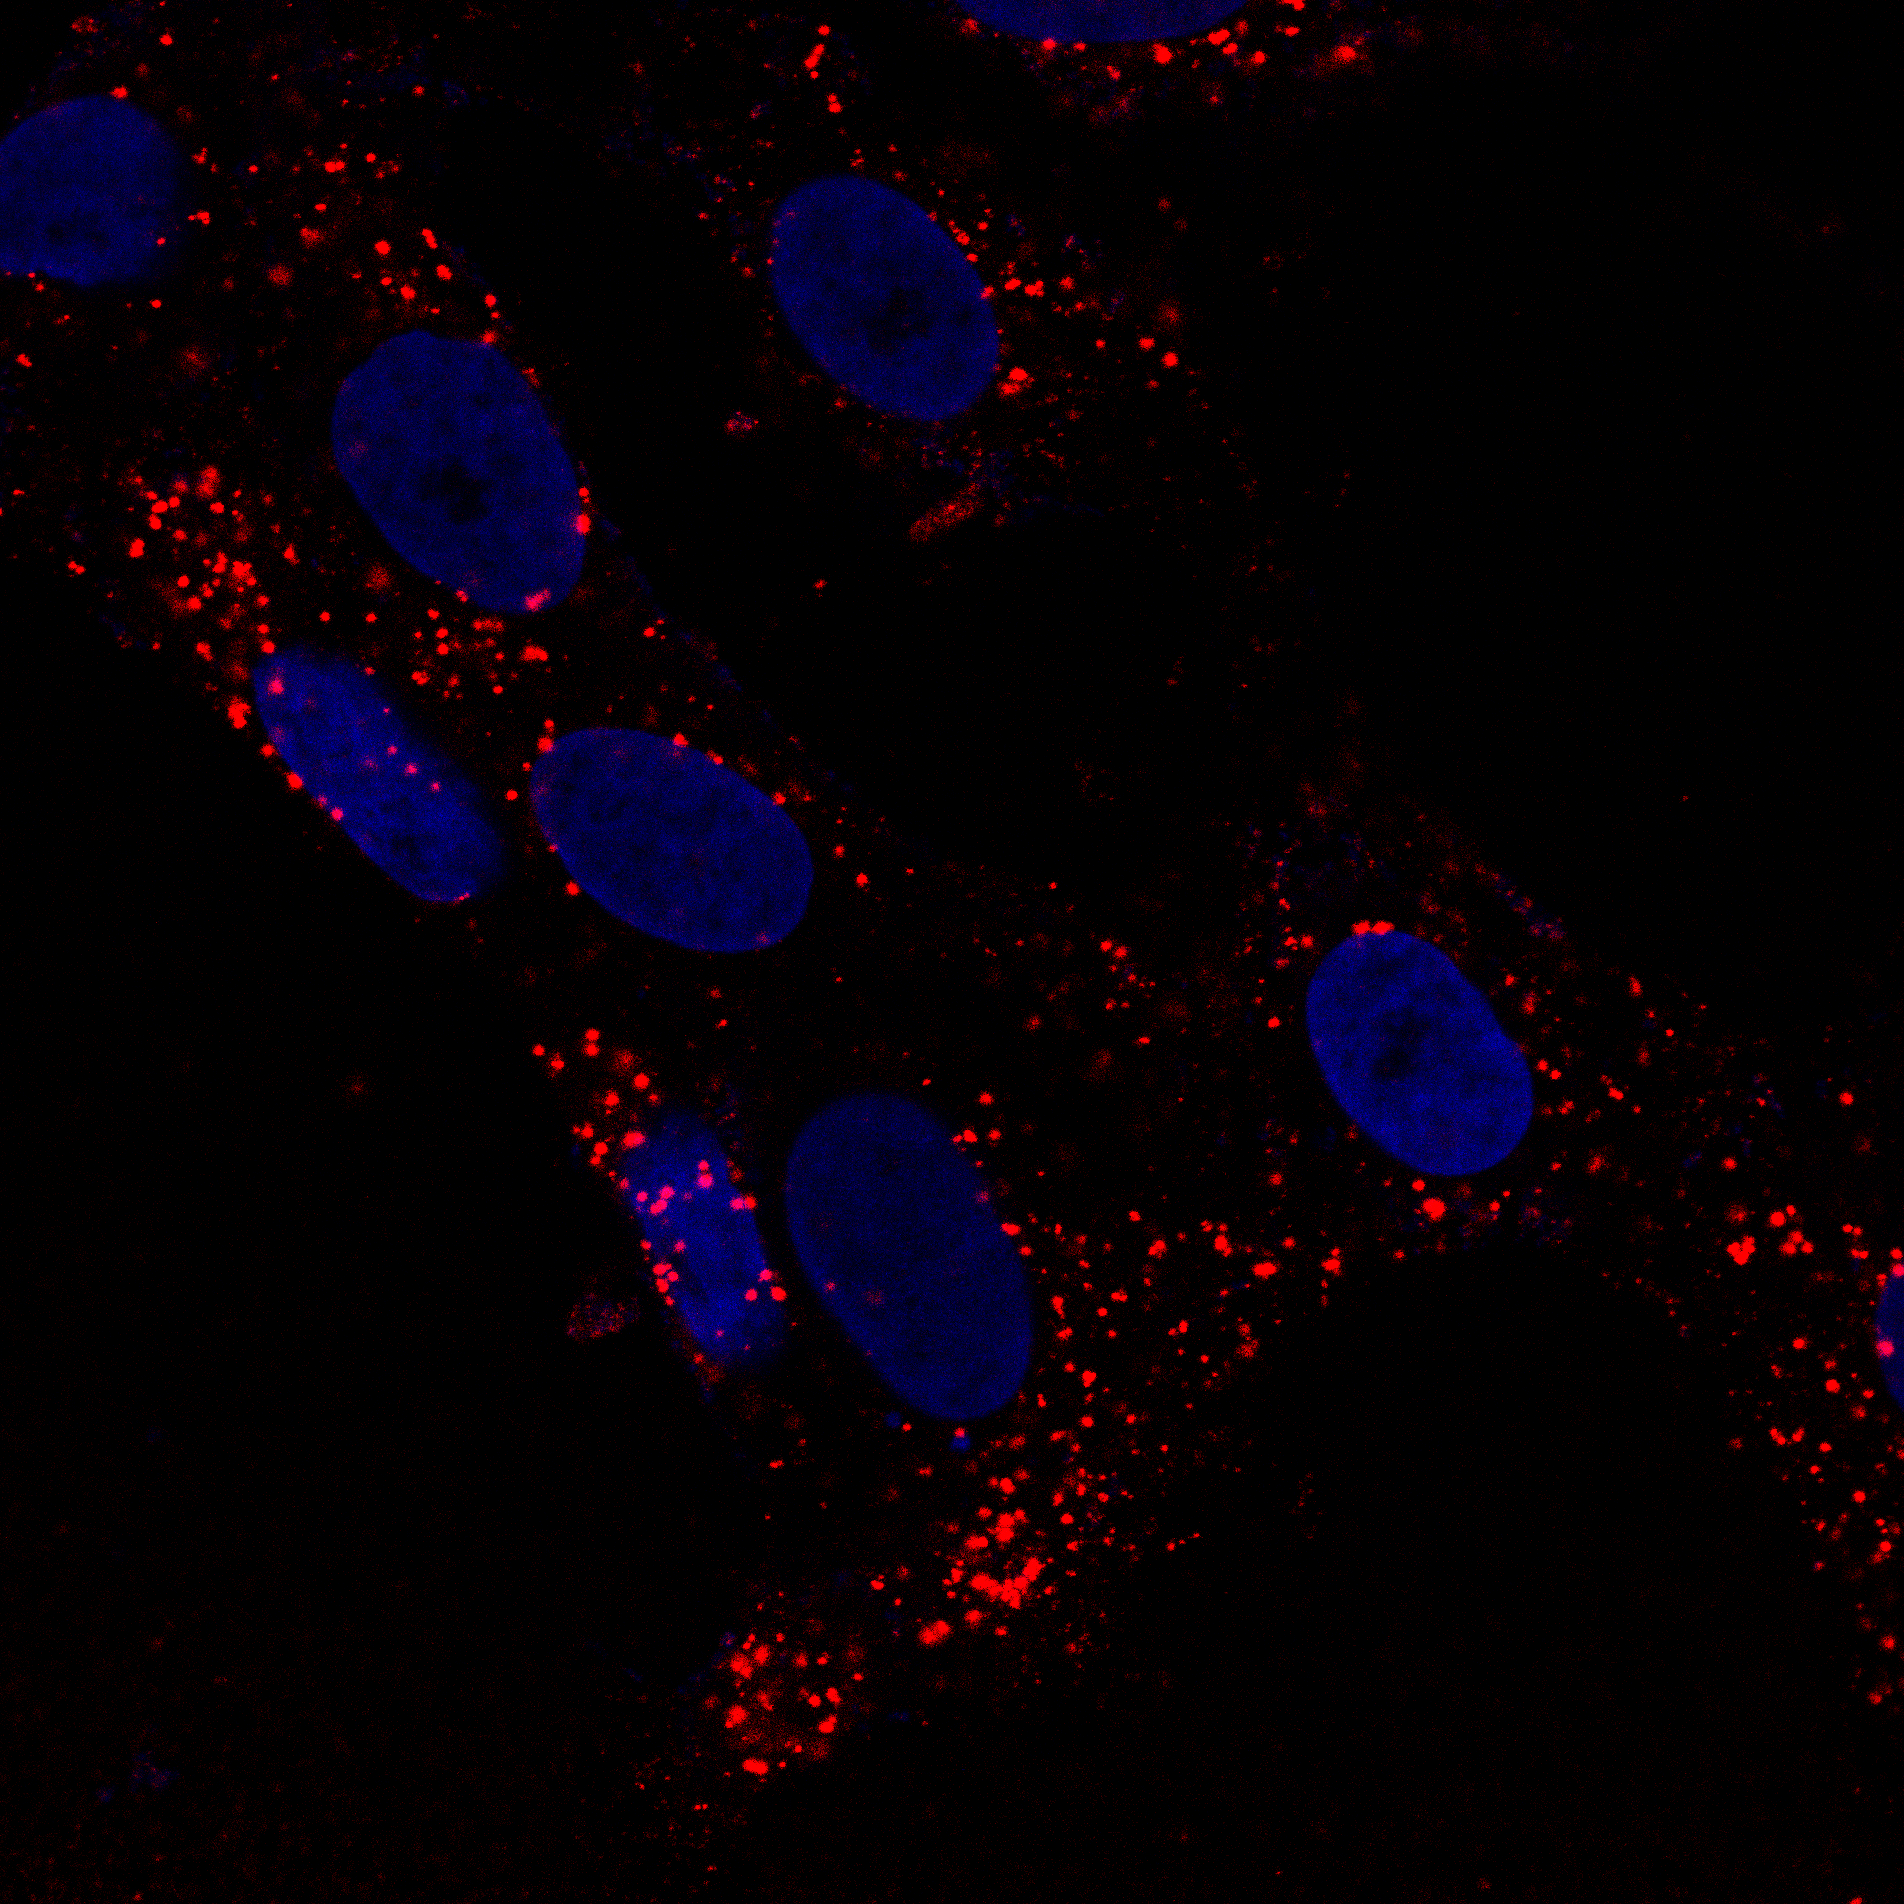
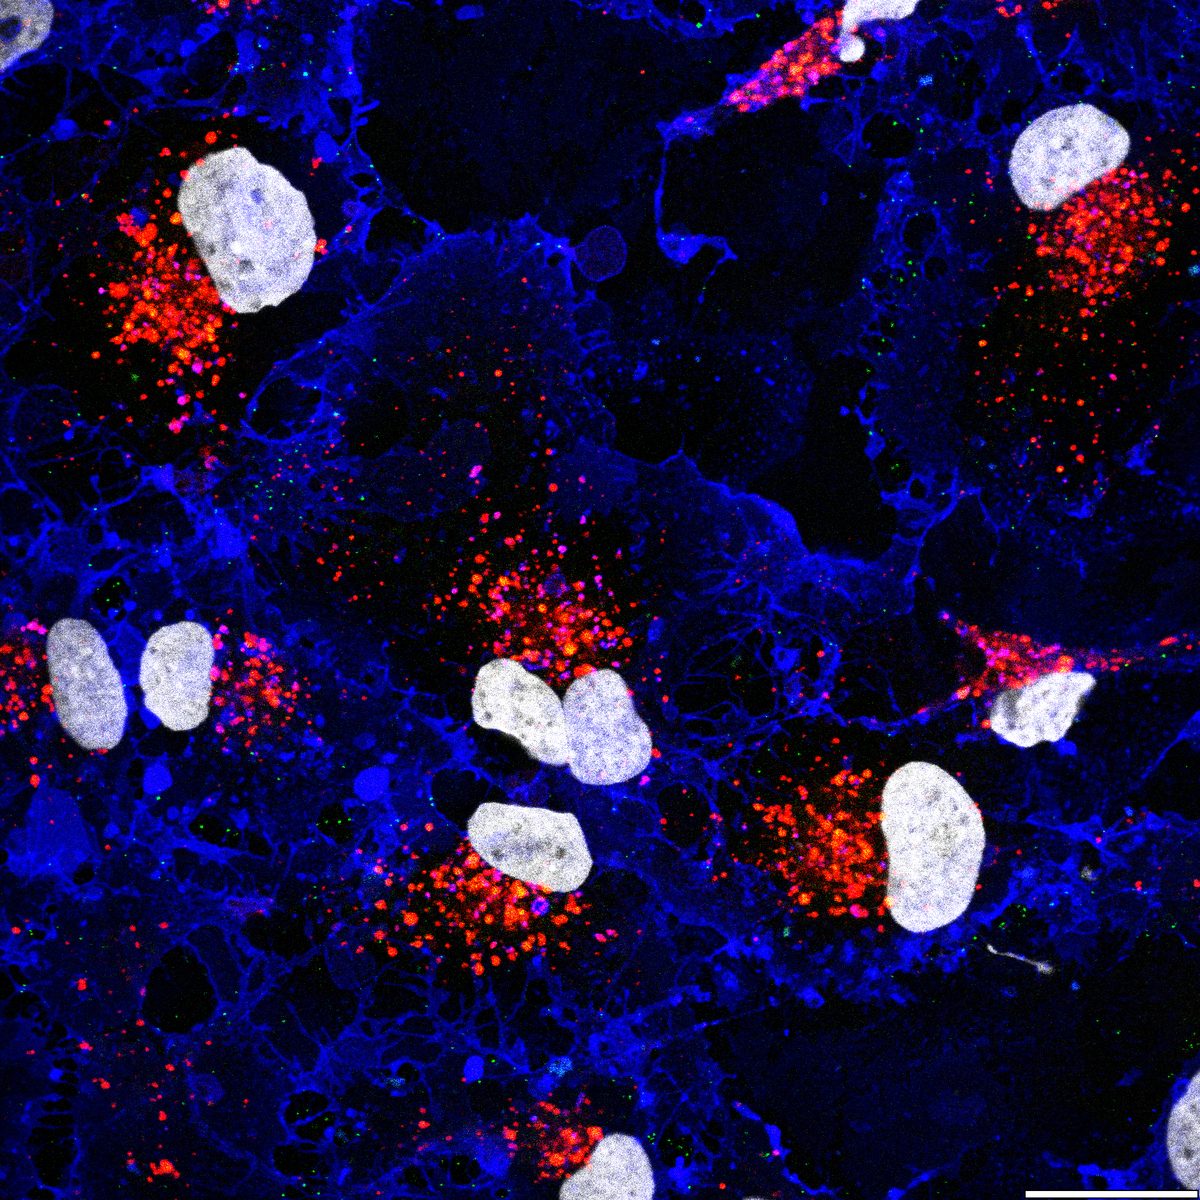
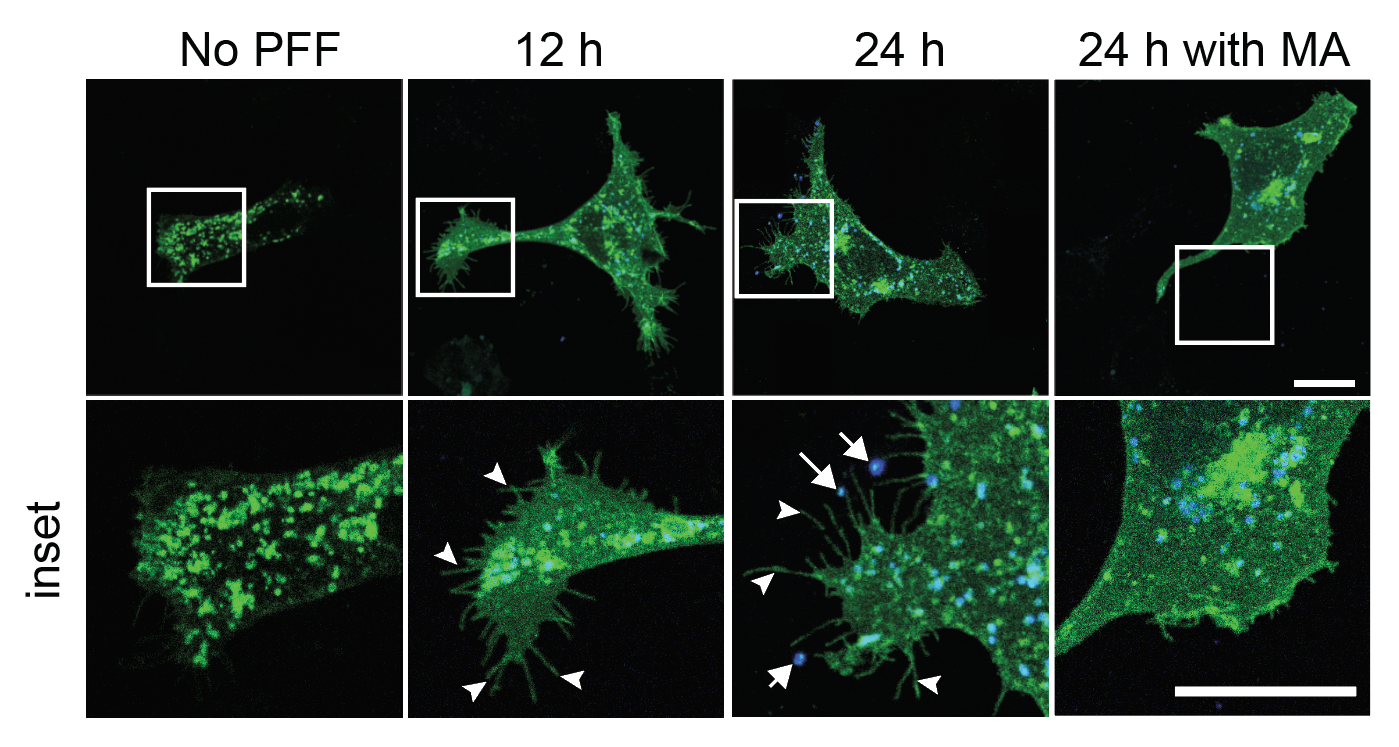
Autophagy flux monitoring via LC3B (green) and PFF (red) co-staining over 21 days. PFF-only treatment shows gradual LC3B+ autophagosome accumulation, while PFF + IFN-γ dual-hit dramatically accelerates LC3B dysfunction and PFF accumulation — reflecting impaired autophagic clearance of fibrils under inflammatory conditions. This time-resolved assay demonstrates progressive pathway collapse. Bayati et al., Nature Neuroscience 2024.

02

Endocytosis, Receptor Biology & Trafficking

I characterize receptor engagement, uptake kinetics, and intracellular trafficking using canonical endocytosis assays (EGF, transferrin) alongside disease-relevant ligands (α-synuclein, Spike–ACE2). Fibrils bypassed early endosomes and reached lysosomes within two minutes. EM-based trafficking with nanogold labeling provided ultrastructural evidence of macropinocytic uptake. Pharmacological inhibitors (EIPA, Latrunculin B) confirmed pathway specificity.

For SARS-CoV-2, I demonstrated that viral spike protein attaches to ACE2 and is internalized through clathrin-mediated endocytosis — the first paper to show this mechanism.

Schematic: macropinocytosis of PFFs, multivesicular body formation, and exosomal release pathway for disease propagation
Schematic illustrating macropinocytosis of α-synuclein PFFs, multivesicular body (MVB) formation, and exosomal release as a mechanism for disease propagation between neurons.

Model of prion-like α-synuclein propagation: PFFs enter neurons via macropinocytosis, traffic to lysosomes via the endosomal pathway, and can escape via multivesicular body (MVB) formation and exosomal release — enabling cell-to-cell disease spread. This pathway is a key therapeutic target, as blocking endocytic entry or enhancing lysosomal degradation could halt disease progression. Based on findings from Bayati et al., JBC 2021.

03

Flow Cytometry & Immunophenotyping

I design and execute multicolor flow cytometry panels for surface target engagement, cell-state markers, intracellular signaling readouts, and activation-state profiling. Applications include cell-surface binding assays to evaluate antibody binding/competition across targets, characterization of differentiated iPSC populations, and immunophenotyping of primary immune cells. I use FlowJo for analysis, with gating/QC and rank-order reporting.

Fig. — Flow Cytometry: Surface Marker Expression
MFI quantification of immune markers on iPSC-derived microglia-like cells ± LPS activation
Multicolor panel: CD11b, CD45, HLA-DR, CX3CR1, P2RY12. MFI normalized to isotype controls.
Fig. — Immunophenotyping: T-Cell Activation Panel
Percent positive cells for activation markers in PBMC-derived T-cells ± anti-CD3/CD28 stimulation
PBMCs stimulated 72h. Gated on CD3+ population. FlowJo analysis.
04

Immune Cell & PBMC-Based Assays

I perform PBMC isolation, culture/activation, and cytokine stimulation to generate ex vivo functional readouts. This includes immune-target co-culture assays, T-cell functional assays, and primary human immune cell workflows. I integrate spectral and conventional flow cytometry immunophenotyping with cytokine quantification (ELISA/MSD/Luminex) to guide follow-up prioritization. I also model cytokine-driven neuroinflammation using controlled exposure to IFN-γ, TNF-α, and IL-1β.

05

Exosome-Mediated Propagation

I demonstrated that α-synuclein fibrils are packaged into exosomes and transferred to naïve cells via CD63/CD9 reporter systems. Gold-labeled PFF visualization by EM showed exosomes decorated with fibrils contacting recipient cell membranes. Exosome isolation from conditioned media, transfer assays, and characterization by confocal, immunoblotting, and TEM established direct evidence for prion-like propagation through extracellular vesicles.

06

Plate-Based & High-Throughput Readouts

I develop and execute plate-based assays in 96- and 384-well formats including CellTiter-Glo viability, FLIPR calcium flux and membrane potential (BMG FLUOstar Omega), high-content imaging (Opera Phenix, Incucyte), AlphaLISA, TR-FRET, HTRF, and BRET-based readouts. Cell painting dyes (LysoTracker, Hoechst, MitoTracker, Cell Mask) enable screening-ready phenotypic assays for organelle state, proteostasis, and cell health quantification.

Fig. — LysoSensor pH Readout
Lysosomal pH measured by LysoSensor DND-189 fluorescence across treatment conditions in DA neurons
Higher RFU = more acidic (healthy). PFF + IFN-γ shows impaired acidification.
Fig. — Lysosomal Fluorescence (LysoTracker)
LysoTracker Red DND-99 puncta quantification per cell across treatment groups (96-well)
Fig. — AlphaLISA: Secreted α-Synuclein
Extracellular α-synuclein quantified by AlphaLISA from conditioned media (384-well format)
Conditioned media collected at 72h post-treatment. AlphaLISA signal normalized to cell count.
07

FLIPR, Incucyte & Functional Screening

I run kinetic functional readouts using FLIPR assays on BMG FLUOstar Omega to quantify calcium flux, membrane potential, and ion channel activity in plate formats supporting screening and profiling. Incucyte live-cell analysis provides real-time confluency, proliferation, and cytotoxicity monitoring.

Fig. — FLIPR: Calcium Flux Kinetic Trace
Intracellular Ca²⁺ response (Fluo-4) in iPSC-derived neurons — vehicle vs KCl vs glutamate stimulation
BMG FLUOstar Omega. 96-well. Injection at t=10s. RFU normalized to baseline.
Fig. — Incucyte: Real-Time Confluency Monitoring
Proliferation curves for iPSC-derived DA neurons ± compound treatment over 7 days
Phase-contrast confluency mask. Readings every 4h. n=6 wells per condition.
08

Immune-Mediated Killing Assays

I build immune-mediated T-cell killing / immune-target co-culture assays and quantify immune-driven target-cell loss and cytokine signaling using flow cytometry and immunoassay readouts. These assays support evaluation of checkpoint biology and mechanism-of-action for biologic candidates.

Fig. — Immune-Target Co-Culture: T-Cell Mediated Killing
Target cell viability at varying E:T ratios ± anti-PD-1 checkpoint blockade
Co-culture 48h. Target viability by CellTiter-Glo. E:T = Effector:Target ratio.