ESC
Primary Culture

Primary Rat Hippocampal Neuronal Culture

Isolation, culture, and functional characterization of primary rat hippocampal neurons from E18 embryonic tissue. These cultures serve as a physiologically relevant platform for studying cargo internalization, lysosomal trafficking, synaptic function, and neurotoxicity — complementing iPSC-derived models with the biological fidelity of native rodent neurons.

Dissection & Plating Maturation & QC Lysosomal Trafficking Electrophysiology Primary Astrocytes Assay Applications Endocytosis iPSC Neurons
01

Hippocampal Dissection, Dissociation & Plating

Primary hippocampal neurons were isolated from E18 Sprague-Dawley rat embryos using established enzymatic dissociation protocols. Timed-pregnant dams were euthanized, embryos harvested under sterile conditions, and hippocampi dissected in ice-cold HBSS. Tissue was enzymatically digested with 0.25% trypsin-EDTA (15 min, 37°C), followed by mechanical trituration with fire-polished glass pipettes to generate a single-cell suspension.

Culture Protocol

🧬
Substrate Preparation & Plating
PDL/LAMININ 50K–100K CELLS/cm²
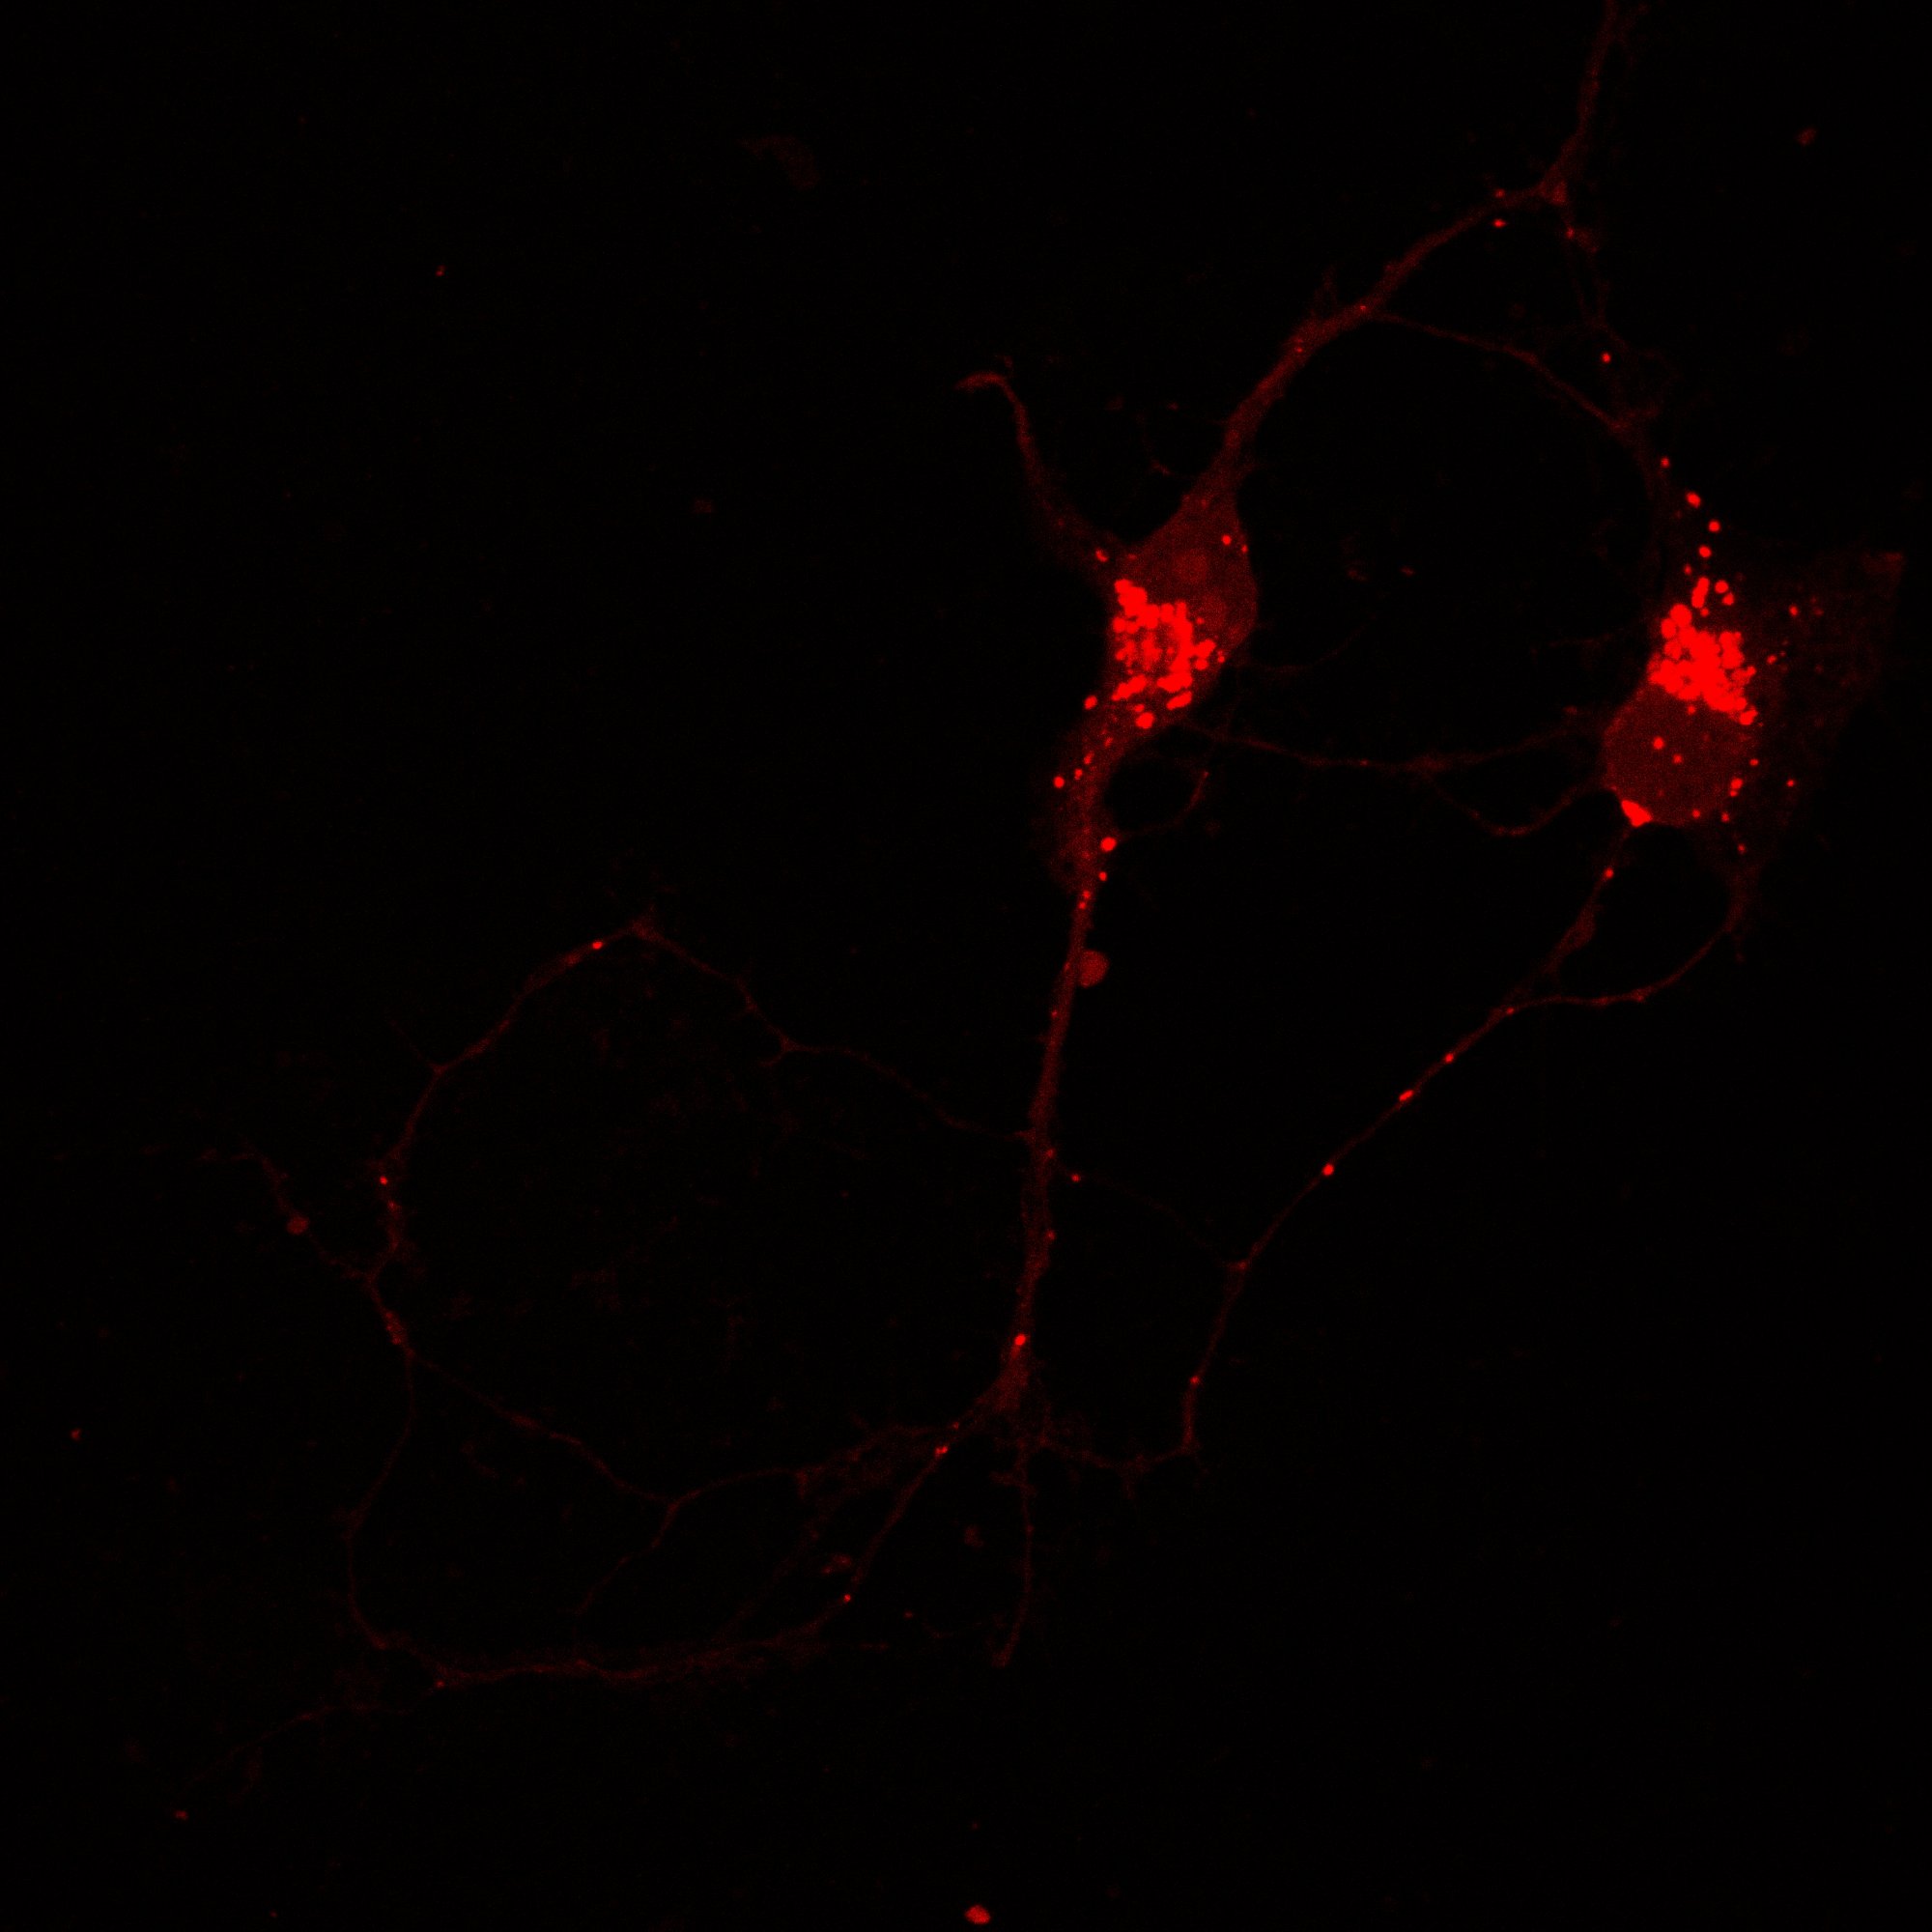
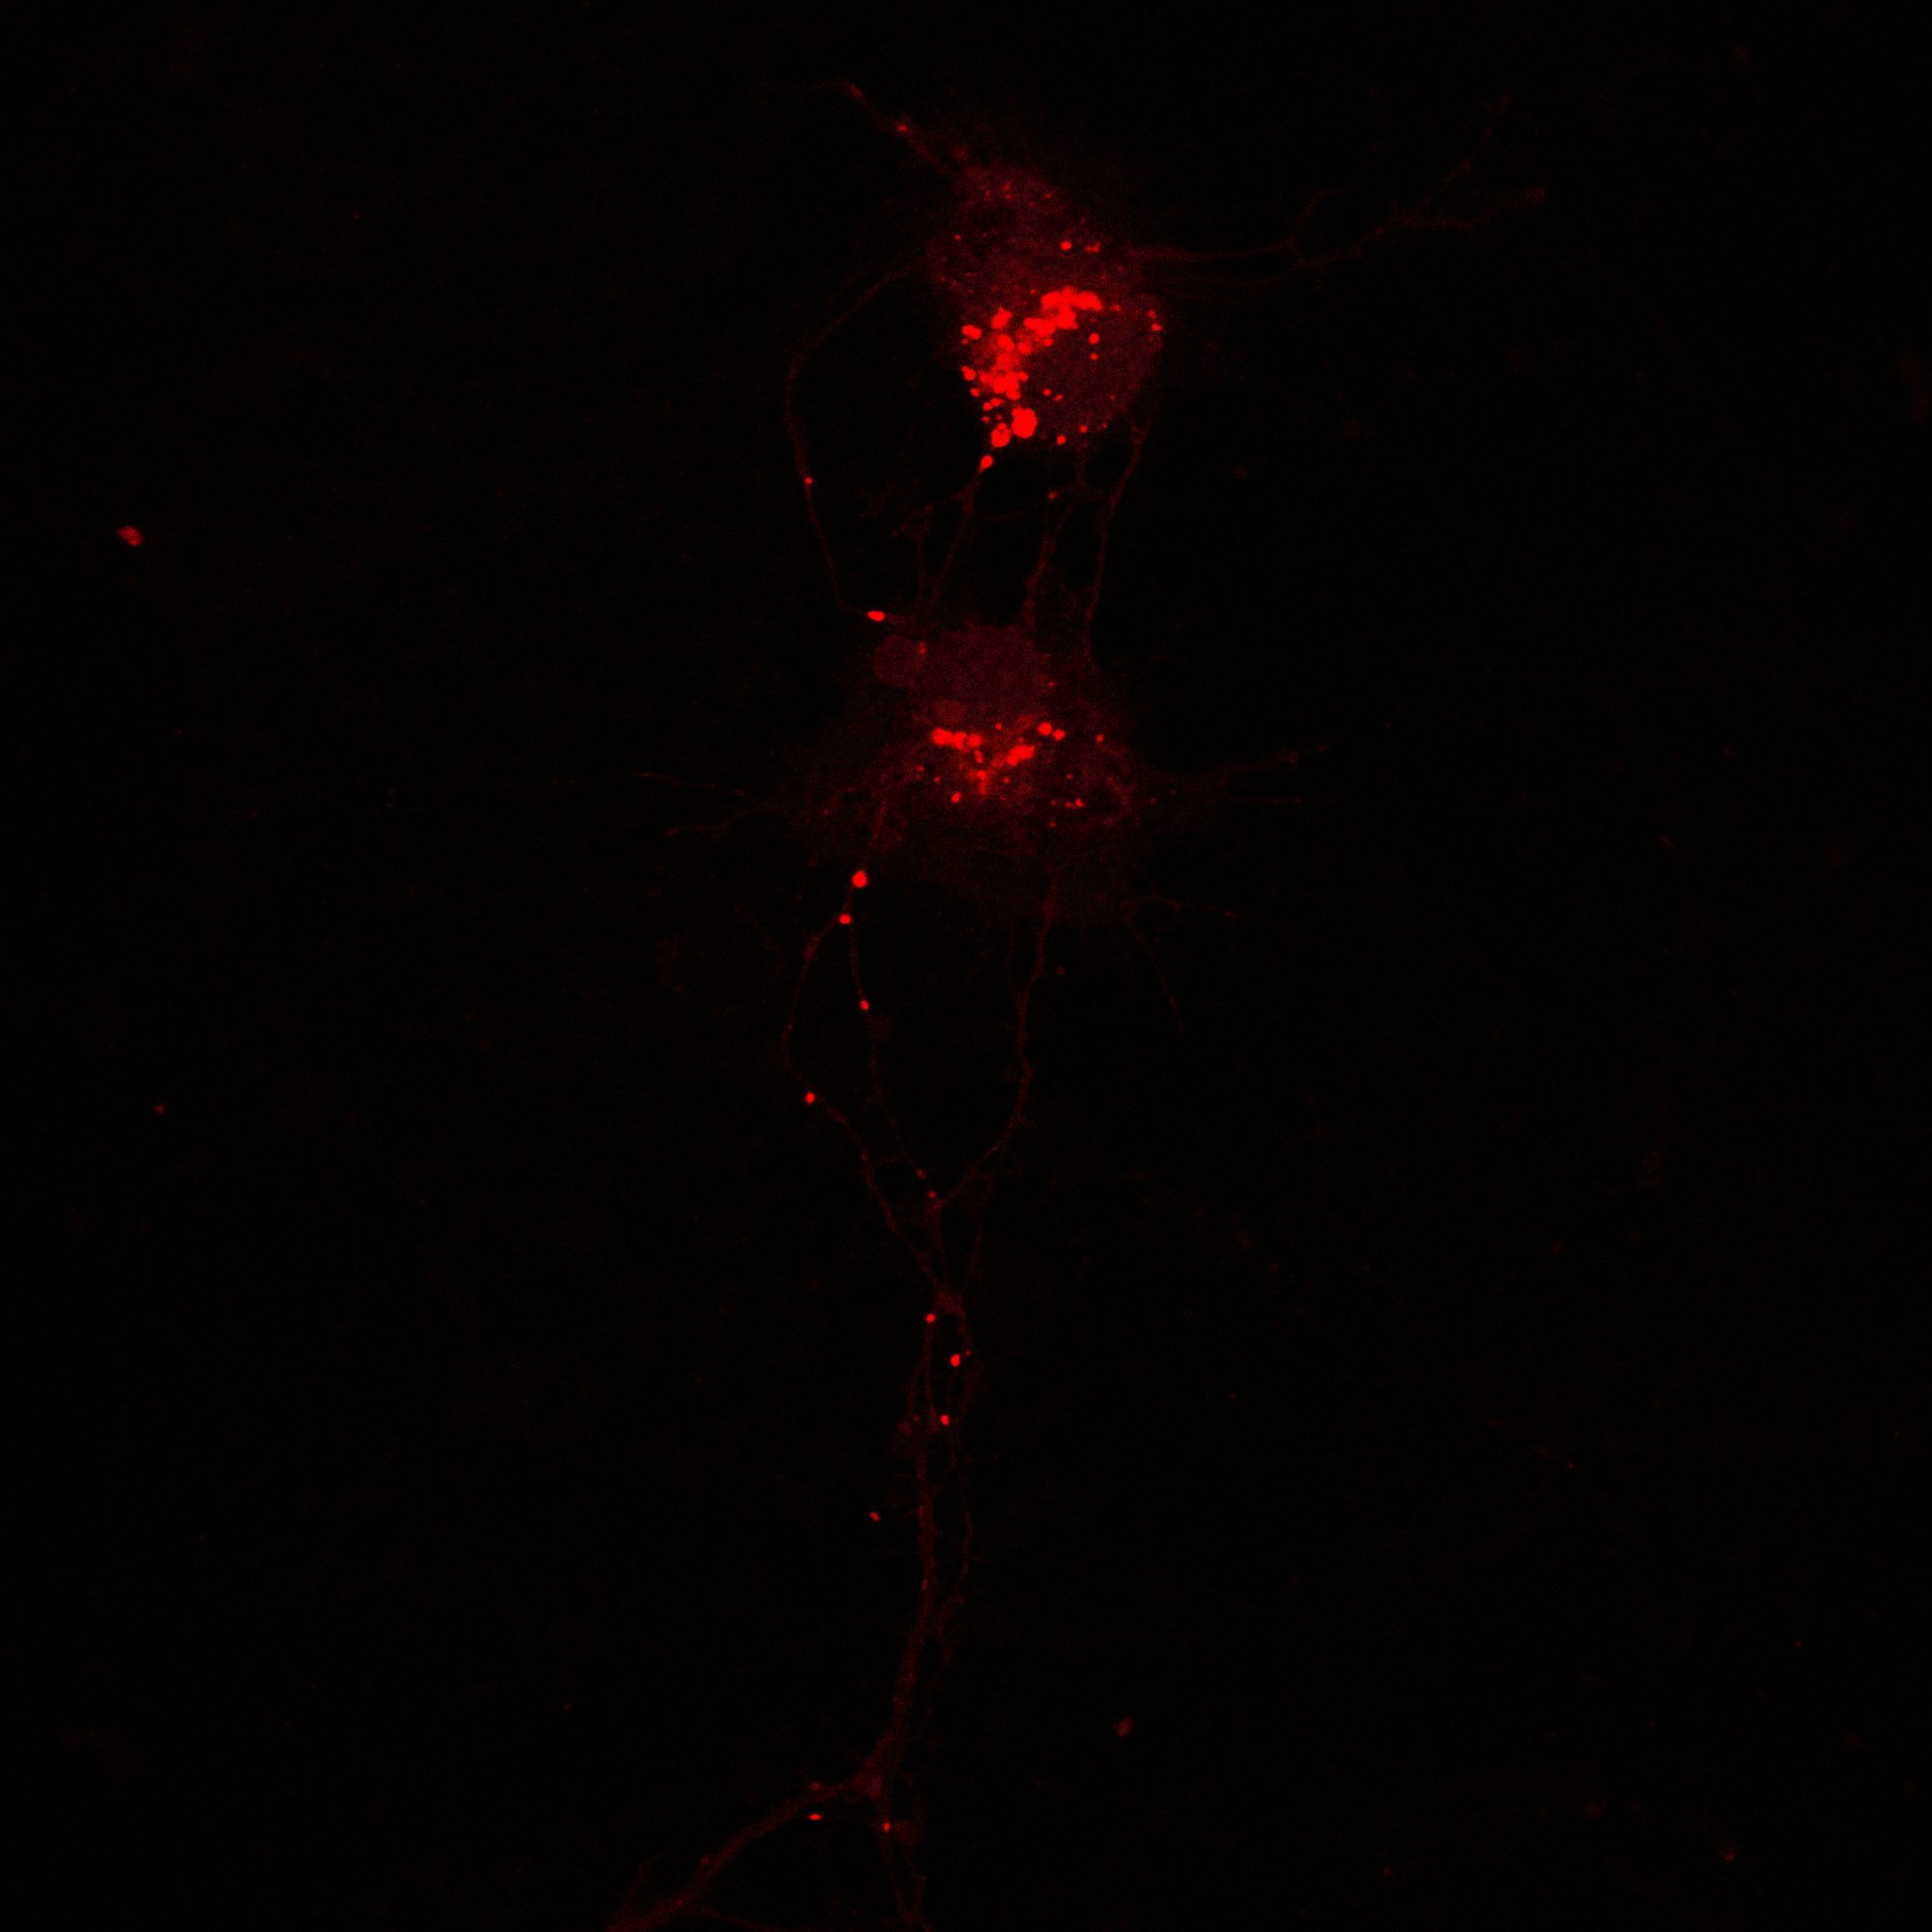
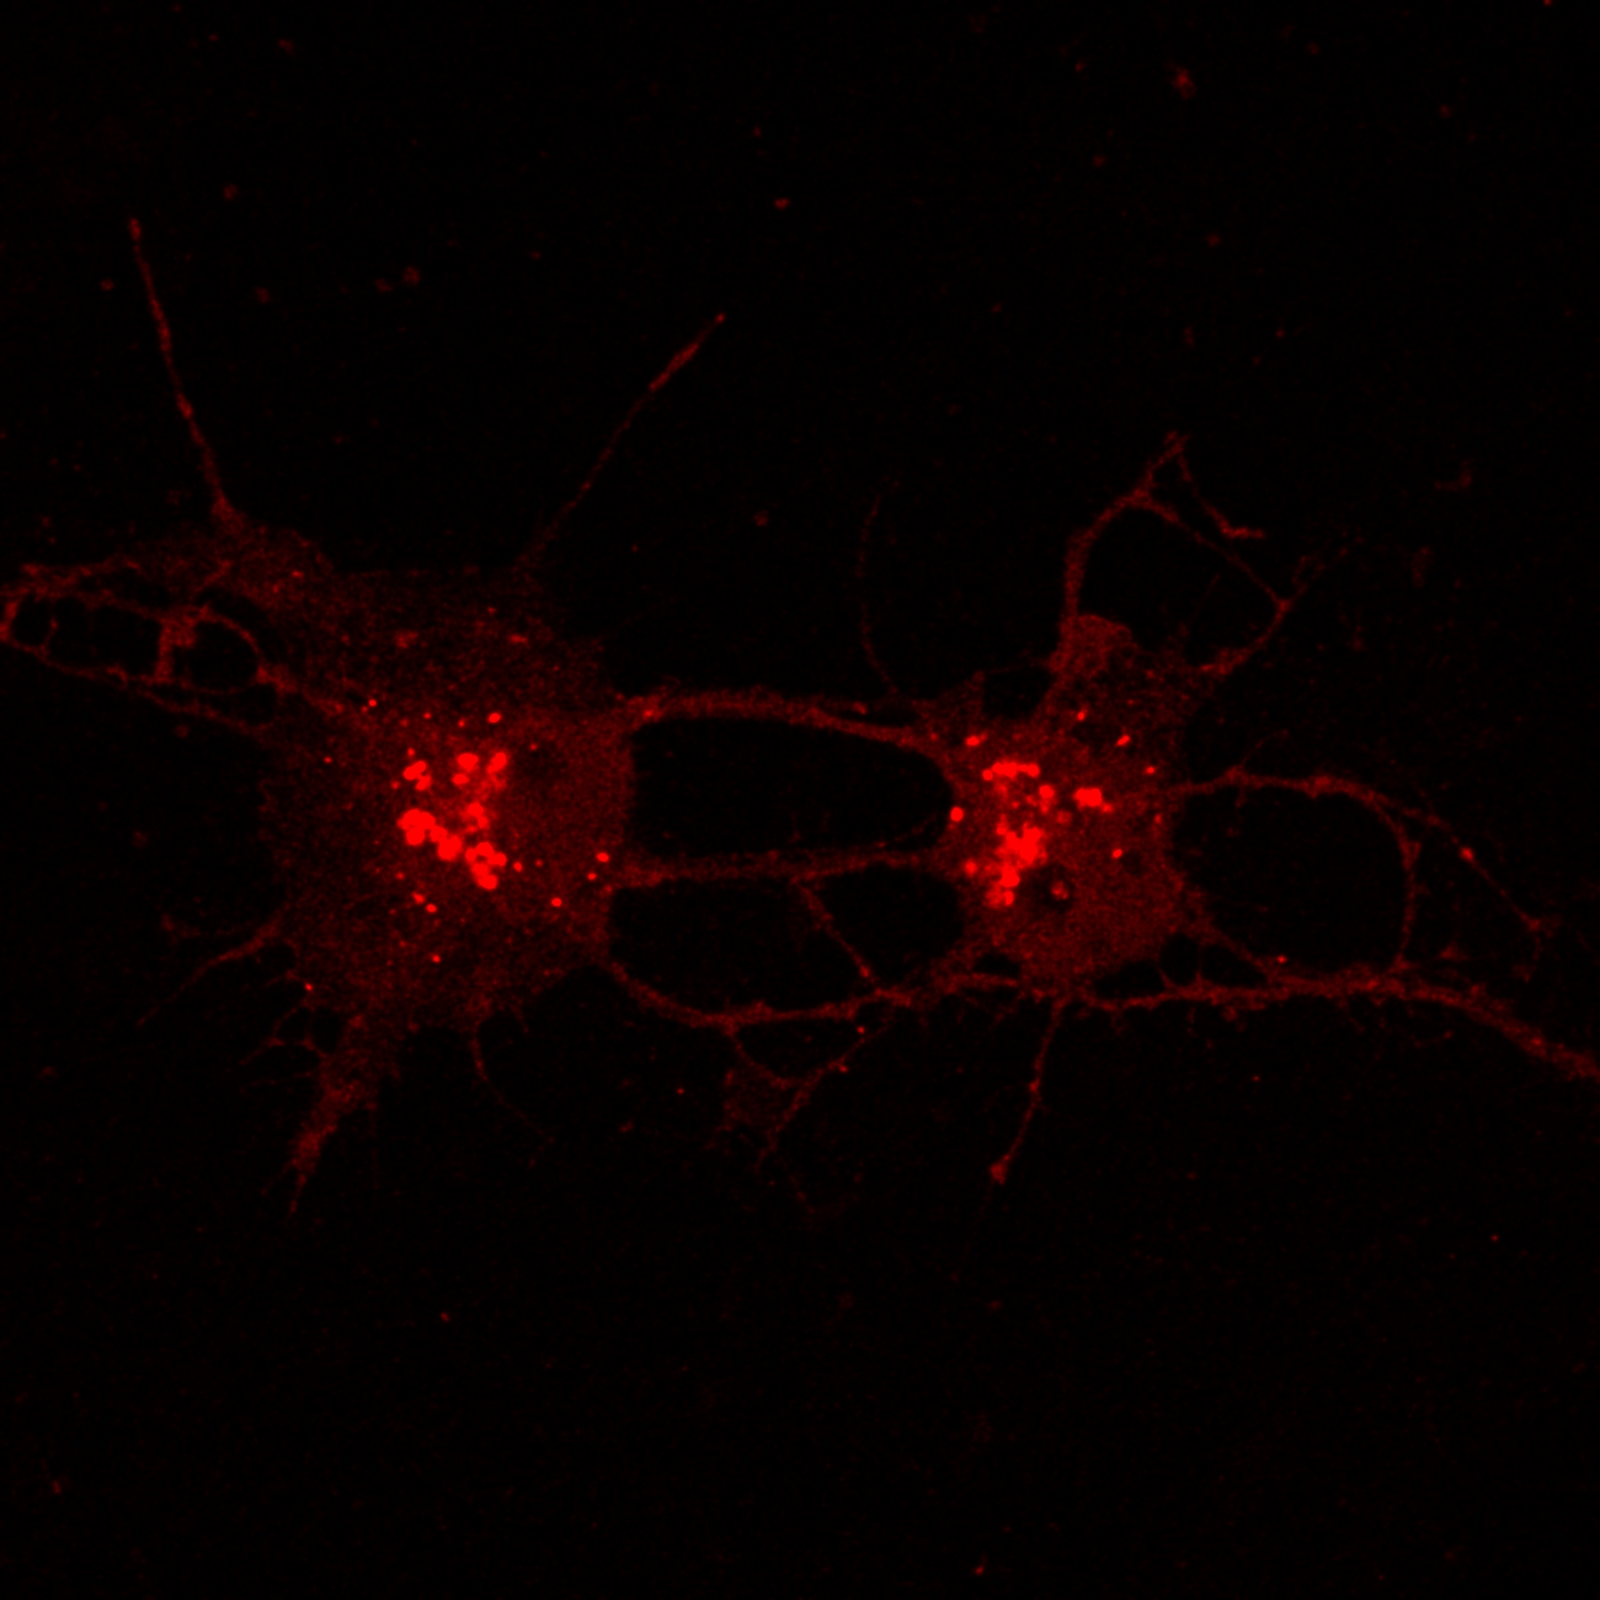
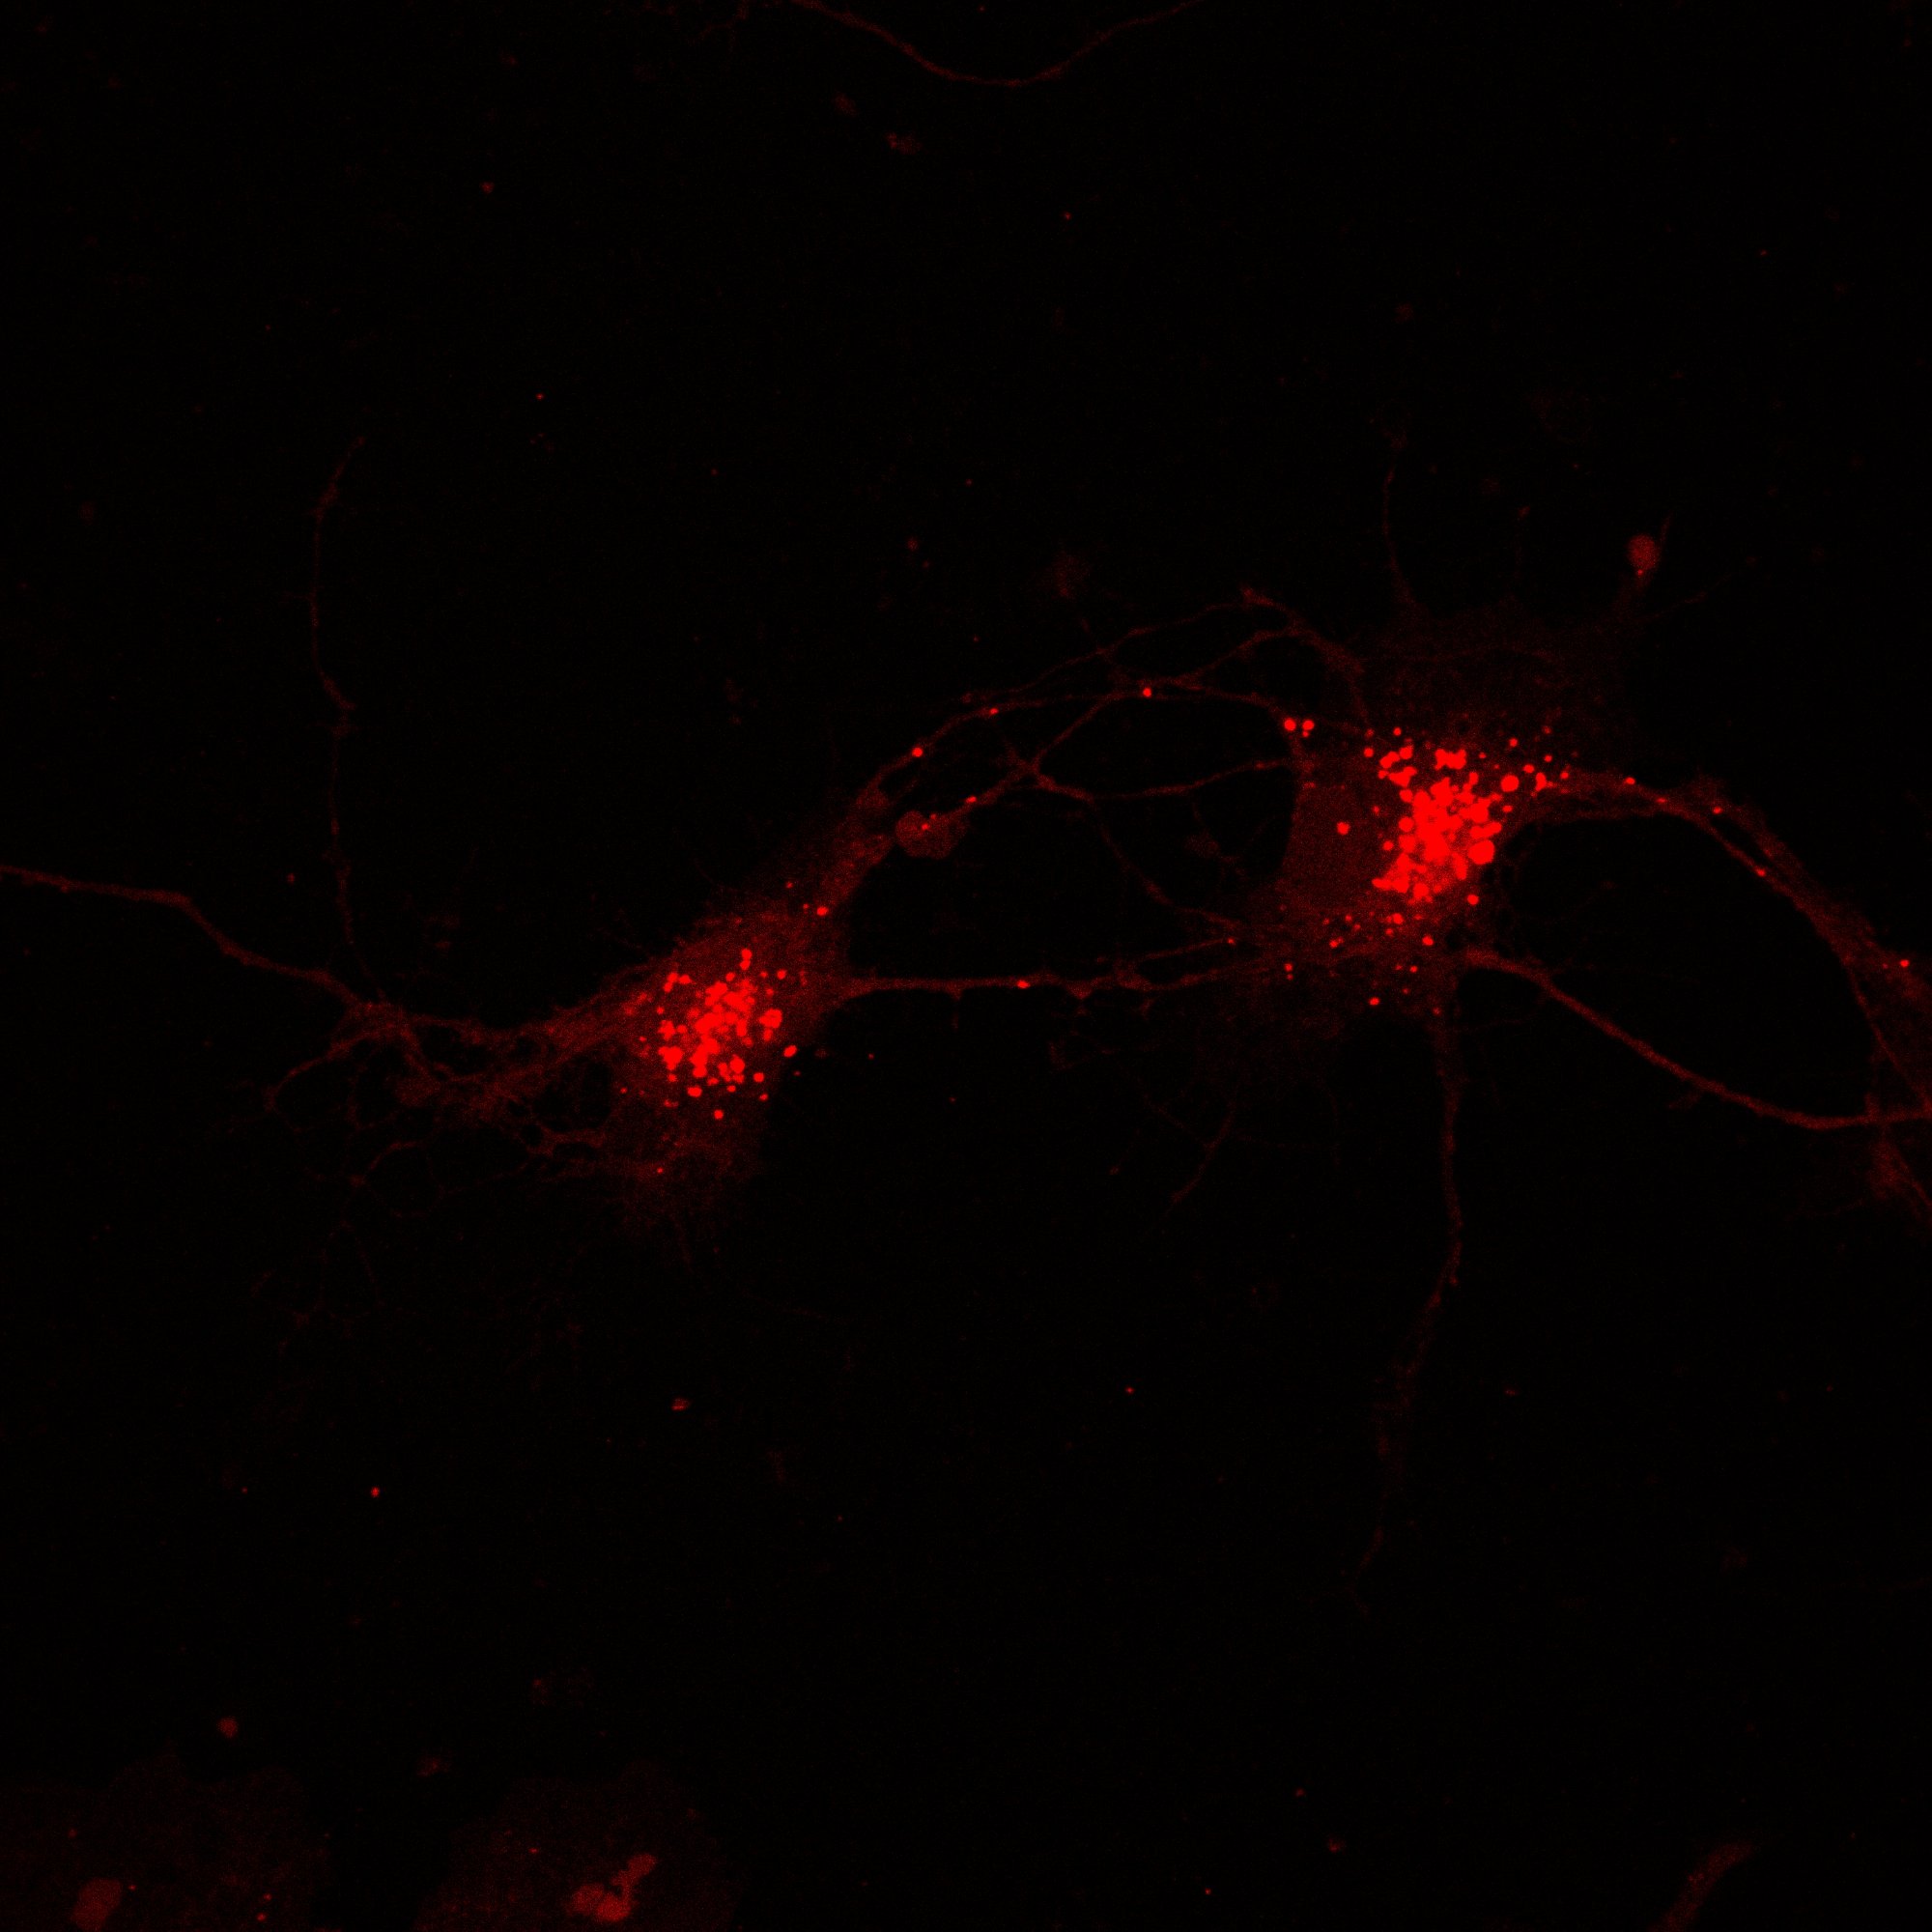
Glass coverslips and multi-well plates were coated with poly-D-lysine (100 μg/mL, overnight) followed by laminin (5 μg/mL, 2 h) to support neuronal adhesion and process outgrowth. Neurons were plated at 50,000–100,000 cells/cm² in Neurobasal medium supplemented with B-27, GlutaMAX (0.5 mM), and penicillin/streptomycin. Half-medium changes were performed every 3–4 days. Cultures were maintained at 37°C, 5% CO2 for up to 28 DIV.

Culture Yield & Viability

ParameterValueMethod
Yield per hippocampus1.2 ± 0.2 × 10⁶ cellsHemocytometer
Post-plating viability (4 h)94.2 ± 1.8%Trypan blue
DIV7 viability91.6 ± 2.4%Calcein-AM / PI
DIV14 viability88.3 ± 3.1%Calcein-AM / PI
DIV21 viability82.7 ± 4.2%Calcein-AM / PI
Neuronal purity (DIV7)92.4 ± 2.1%MAP2+ / DAPI
Astrocyte contamination6.8 ± 1.4%GFAP+ / DAPI
AraC treatment (DIV3)5 μM, 24 hAnti-mitotic
1.2M
Cells per hippocampus
94%
Post-plating viability
92%
MAP2+ neuronal purity
02

Neuronal Maturation & Identity Validation

Cultures were assessed at regular intervals (DIV3, 7, 14, 21) for morphological maturation, marker expression, and functional properties. Hippocampal neurons develop extensive dendritic arbors by DIV7 and form functional synaptic networks by DIV14–21.

Marker Expression Across Maturation

MarkerTargetDIV3 (%)DIV7 (%)DIV14 (%)DIV21 (%)
MAP2Dendrites62 ± 592 ± 294 ± 293 ± 3
Tuj1 (βIII-tubulin)Pan-neuronal78 ± 495 ± 296 ± 195 ± 2
NeuNMature neurons18 ± 664 ± 586 ± 391 ± 2
Synapsin-1Presynaptic4 ± 228 ± 672 ± 488 ± 3
PSD-95Postsynaptic2 ± 122 ± 568 ± 584 ± 4
vGLUT1Glutamatergic8 ± 342 ± 674 ± 482 ± 3
GAD67GABAergic3 ± 112 ± 316 ± 318 ± 2
GFAPAstrocytes5 ± 27 ± 18 ± 29 ± 2
📈
Morphometric Analysis
NEURITE LENGTH BRANCHING SPINE DENSITY
Sholl analysis and neurite tracing (NeuronJ / FIJI) revealed progressive dendritic arborization: mean total neurite length increased from 142 ± 28 μm at DIV3 to 1,840 ± 215 μm at DIV14. Primary dendrite count plateaued at 5.8 ± 0.9 by DIV7. Dendritic spine density reached 4.2 ± 0.8 spines/10 μm at DIV21, with mature mushroom-type spines comprising 38% of the total spine population.
1,840 μm
Mean neurite length at DIV14
4.2/10 μm
Spine density at DIV21
88%
Synapsin-1+ at DIV21
03

Lysosomal Staining & Cargo Trafficking in Primary Neurons

To characterize the endolysosomal system in primary hippocampal neurons, we performed live-cell LysoTracker Red staining at multiple time points (2, 5, 10 min exposures) to map lysosomal distribution, density, and cargo trafficking dynamics. These images demonstrate the perinuclear lysosomal clustering and neurite-distributed puncta characteristic of healthy hippocampal neurons, providing the baseline for cargo delivery and endosomal escape experiments.

Primary rat hippocampal neuron — LysoTracker Red staining, 2-minute exposure showing perinuclear lysosomal clusters
DIV7 hippocampal neuron — 2 min LysoTracker Red. Perinuclear lysosomal clustering with distributed puncta along proximal neurites.
Primary rat hippocampal neuron — LysoTracker Red staining showing bipolar morphology and lysosomal accumulation
DIV7 bipolar neuron — 2 min LysoTracker Red. Dense lysosomal accumulation at the soma with anterograde transport into primary neurite.
Primary rat hippocampal neuron — 10-minute LysoTracker exposure showing expanded lysosomal network
10-min LysoTracker Red exposure. Extended incubation reveals the full cytoplasmic lysosomal network with membrane-associated signal throughout the soma.
Primary rat hippocampal neurons — 5-minute LysoTracker exposure showing paired neurons with lysosomal puncta along neurites
5-min exposure — paired hippocampal neurons with lysosomal puncta distributed along interconnecting neurites, demonstrating inter-somal lysosomal transport.

Quantitative Lysosomal Parameters

ParameterDIV7DIV14DIV21Method
Lysosomal puncta per soma42 ± 868 ± 1174 ± 13LysoTracker + CellProfiler
Mean puncta diameter (μm)0.48 ± 0.060.52 ± 0.070.56 ± 0.08Confocal + FIJI
Neurite lysosomal density (per 50 μm)3.2 ± 0.96.8 ± 1.48.4 ± 1.8Line-scan quantification
Perinuclear clustering index0.72 ± 0.050.68 ± 0.060.64 ± 0.07Radial distribution
Lysosomal pH (LysoSensor)4.6 ± 0.24.5 ± 0.24.5 ± 0.3Ratiometric imaging
LAMP1+ fraction (%)88 ± 492 ± 391 ± 3ICC colocalization
74
Lysosomal puncta per soma (DIV21)
pH 4.5
Lysosomal acidification confirmed
92%
LysoTracker–LAMP1 colocalization
04

Functional Validation — Electrophysiology & Calcium Imaging

Network-level and single-cell functional maturation was assessed by multi-electrode array (MEA) recordings and calcium imaging (Fluo-4 AM / GCaMP6s). Primary hippocampal cultures develop spontaneous network bursting by DIV10–12 and stable synchronous activity by DIV14.

MEA Functional Parameters

ParameterDIV7DIV14DIV21
Mean firing rate (Hz)0.8 ± 0.34.6 ± 1.28.2 ± 2.1
Active electrodes (%)32 ± 878 ± 688 ± 5
Burst rate (bursts/min)1.2 ± 0.56.8 ± 1.412.4 ± 2.8
Network burst duration (ms)86 ± 22148 ± 34212 ± 42
Synchrony index0.18 ± 0.060.62 ± 0.080.78 ± 0.06
Primary Hippocampal Neuron Network Maturation
MEA metrics from DIV7 to DIV21. Mean ± SEM, n = 6 wells per time point.
8.2 Hz
Mean firing rate at DIV21
0.78
Synchrony index at DIV21
88%
Active electrodes at DIV21
05

Primary Mouse Astrocyte Culture — Lysosomal Distribution in Fetal Astrocytes

In addition to primary neuronal culture, I isolate and culture primary mouse astrocytes from fetal cortical tissue to study glial biology, lysosomal function, and neuron–glia interactions. As part of a comparative study of fetal vs. adult astrocyte biology, I characterized the lysosomal number, size distribution, and spatial organization in fetal astrocytes using LysoTracker Red and GFAP/cytoskeletal co-staining (blue). These parameters are critical for understanding how astrocytes handle cargo uptake, degradation, and intercellular transfer at different developmental stages.

Primary fetal mouse astrocyte showing dense perinuclear lysosomal accumulation with stellate GFAP morphology
Fetal astrocyte — dense perinuclear lysosomal accumulation with stellate GFAP+ morphology. Lysosomes concentrate in the soma with scattered puncta in lamellipodia.
Primary fetal mouse astrocyte with elongated bipolar morphology showing lysosomal gradient from soma to process tip
Fetal astrocyte — bipolar morphology with lysosomal gradient from soma to process tip. Distal processes show sparse but detectable lysosomal puncta. Scale bar: 10 μm.

Fetal Astrocyte Lysosomal Characterization

Lysosomal parameters were quantified in primary fetal mouse astrocytes (E16–E18 cortical isolation, DIV7–14) and compared to age-matched adult astrocytes isolated from P60 cortex. Fetal astrocytes displayed a higher lysosomal density and more dispersed spatial distribution, consistent with their elevated endocytic and phagocytic capacity during development.

ParameterFetal (E16–E18)Adult (P60)Fold ChangeMethod
GFAP+ purity (%)94.2 ± 2.191.8 ± 2.6ICC
Lysosomal puncta per cell126 ± 1874 ± 121.7×LysoTracker + CellProfiler
Mean puncta diameter (μm)0.62 ± 0.080.78 ± 0.100.8×Confocal + FIJI
Perinuclear fraction (%)58 ± 672 ± 50.8×Radial distribution
Process-distributed fraction (%)42 ± 628 ± 51.5×Radial distribution
Lysosomal pH (LysoSensor)4.4 ± 0.24.6 ± 0.2Ratiometric imaging
LAMP1+ colocalization (%)91 ± 389 ± 4Pearson's R
Cathepsin D activity (RFU/cell)2,840 ± 3201,960 ± 2801.45×Magic Red assay
🔬
Fetal vs. Adult Lysosomal Biology
LYSOTRACKER LYSOSENSOR CATHEPSIN D GFAP
Fetal astrocytes contained 1.7× more lysosomal puncta per cell than adult astrocytes, with a significantly higher fraction distributed into distal processes (42% vs. 28%). This dispersed lysosomal pattern in fetal astrocytes reflects elevated endocytic and phagocytic activity during development — consistent with their role in clearing apoptotic debris and sculpting synaptic connections. Fetal lysosomes were also smaller in diameter (0.62 vs. 0.78 μm) but more catalytically active (1.45× higher cathepsin D activity), suggesting a more dynamic, rapid-turnover lysosomal pool. These findings establish fetal astrocytes as a high-capacity cargo processing system with relevance to delivery vehicle screening.
1.7×
More lysosomes in fetal vs. adult astrocytes
42%
Process-distributed lysosomes (fetal)
1.45×
Higher cathepsin D activity (fetal)
06

Downstream Assay Applications

Primary hippocampal cultures served as the foundation for multiple cargo delivery, trafficking, and neurotoxicity assays across my research program:

🔬
Cargo Internalization
α-Synuclein PFF uptake kinetics in primary neurons vs. iPSC-derived neurons. Macropinocytic entry confirmed in both systems. Primary neurons showed 40% faster lysosomal routing than immortalized lines.
💬
Neurotoxicity Screening
Dose-response neurotoxicity for cytokine cocktails (TNF-α, IL-1β, IFN-γ), oxidative stressors (rotenone, MPP+), and excitotoxins (glutamate, NMDA). LD50 determination by CellTiter-Glo and LDH release.
Lysosomal Stress Paradigms
LysoTracker/LysoSensor profiling under dual-hit (PFF + IFN-γ) conditions. Primary neurons recapitulated the lysosomal alkalinization and reduced puncta count observed in iPSC-DA models.
💫
Synaptic Function Assays
FM1-43 vesicle recycling, miniature EPSC (mEPSC) recordings, and glutamate release quantification (Amplex Red). Synaptic function assessed before and after pharmacological or cargo treatment.

Primary Neuronal Culture Workflow

01
Dissection
E18 rat hippocampal dissection. Trypsin digestion + trituration. Viability and yield QC.
02
Culture & QC
PDL/laminin plating. AraC at DIV3. ICC for MAP2, Tuj1, NeuN, GFAP at DIV7/14/21.
03
Functional Validation
MEA electrophysiology. Calcium imaging. Synaptic marker quantification. Network analysis.
04
Assay Deployment
Cargo uptake, lysosomal trafficking, neurotoxicity screening, and pharmacological rescue experiments.