ESC
Therapeutics & Translation

Drug Discovery & Translational Research

I connect mechanistic insights to therapeutic development by testing small molecules, building biomarker strategies, and advancing preclinical programs from discovery through decision-enabling datasets.

Parkin Agonists Telomerase Activating Compound Lysosomal Rescue Antiviral Targets TE/PD Biomarkers Oncology
01

Parkin Agonist Development

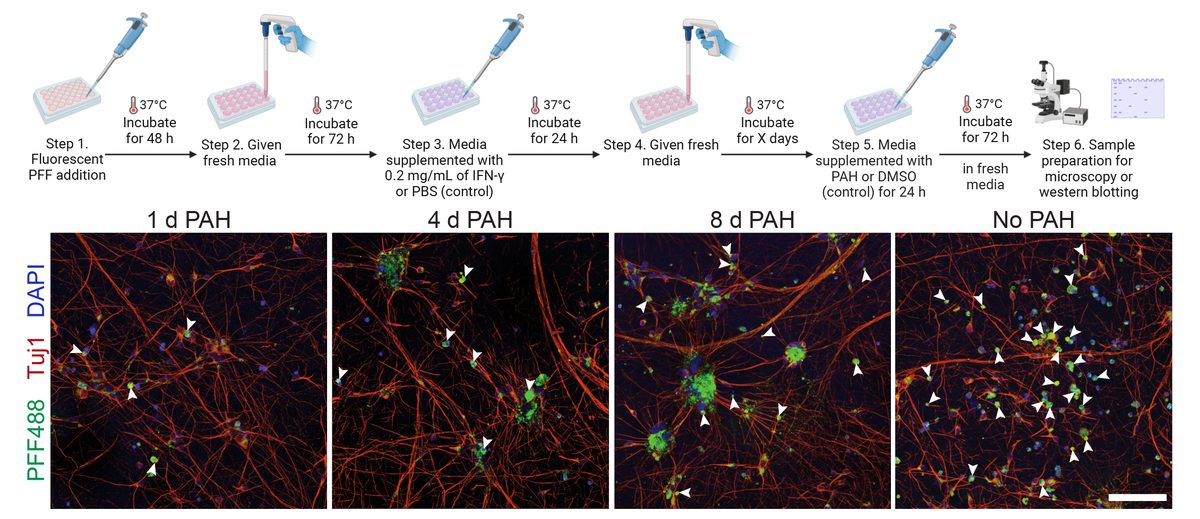
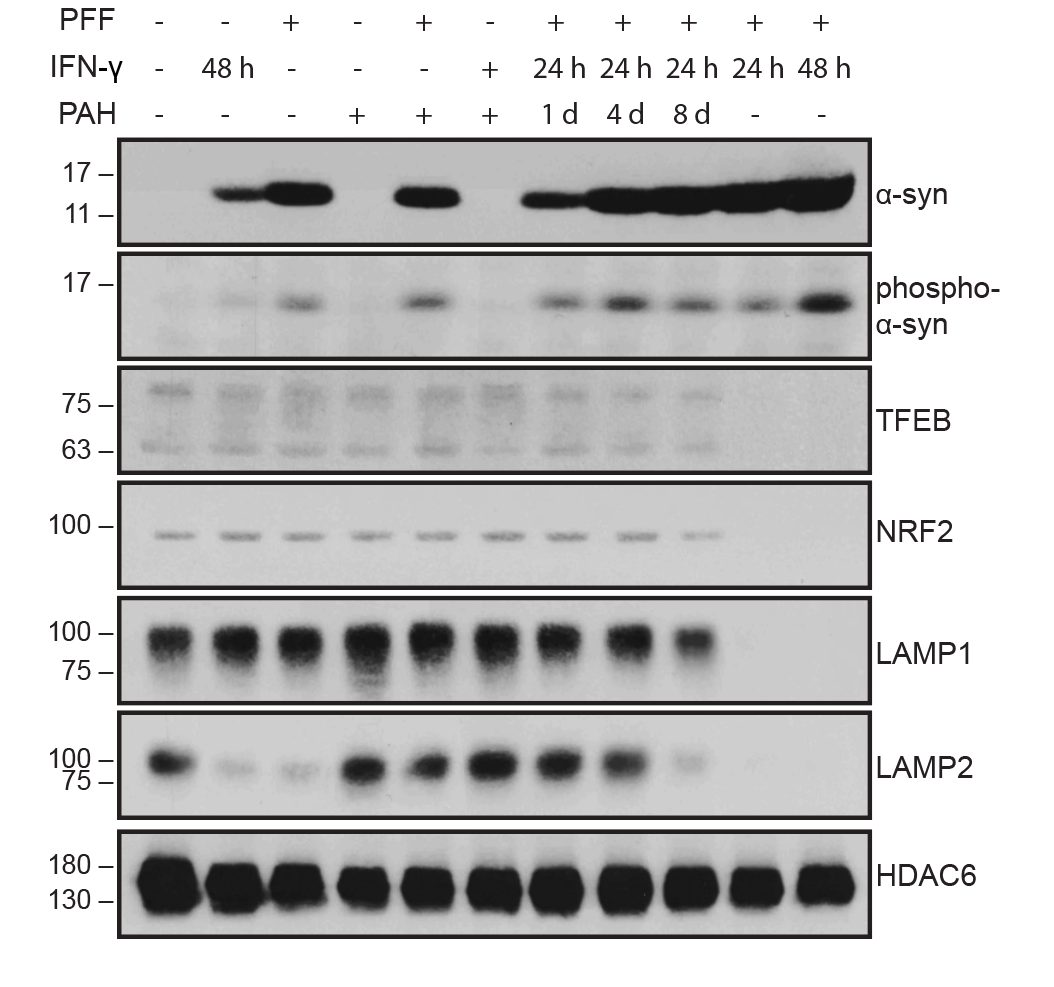
I collaborated with chemical biologists to identify small-molecule activators of Parkin. In dopaminergic neurons, Parkin agonists enhanced mitophagy, improved survival, and protected against α-synuclein–induced degeneration. I also demonstrated that Parkin loss shifts cell fate toward glial lineages, linking target perturbation to lineage-state biomarkers for translational stratification.

I generated oncology-facing rationale integrating observations that PARK2 downregulation is common across cancers with cell-based efficacy readouts. Manuscript under review, Nature Aging.

02

TAC & Lysosomal Rescue

I evaluated a Telomerase Activating Compound (TAC) designed to enhance neuronal resilience by targeting mitochondrial and lysosomal biology. In iPSC-derived neurons, TAC reduced α-synuclein pathology, restored integrated stress response markers (ATF4/ATF3), and decreased senescence-associated phenotypes.

In parallel, I demonstrated that Perillaldehyde (PAH) rescues lysosomal function in the dual-hit model, restoring LAMP1, LAMP2, NRF2, and TFEB protein levels while progressively clearing α-synuclein inclusions over 8 days. Western blot pharmacodynamic profiling confirmed reduction of both total and phosphorylated α-synuclein, decreased HDAC6 (aggresome marker), and normalized autophagy-lysosomal pathway proteins — providing a multi-readout therapeutic validation dataset. Published in Bayati et al., Nature Neuroscience 2024.

Treatment timeline and confocal microscopy: PAH reducing alpha-synuclein inclusions over 1, 4, and 8 days versus untreated
Confocal immunofluorescence showing reduced α-synuclein–positive perinuclear inclusions in neurons treated with PAH (parkin agonist) vs vehicle control.

Perillaldehyde (PAH) treatment timeline and confocal time course. PAH rescues lysosomal function and progressively reduces α-synuclein inclusion burden over 8 days in iPSC-derived DA neurons treated with the dual-hit protocol. Left panels show treatment scheme; right panels show confocal imaging at Day 1, 4, and 8 demonstrating inclusion clearance versus no-treatment control. Bayati et al., Nature Neuroscience 2024.

Western blots showing PAH treatment effects on alpha-synuclein, phospho-alpha-synuclein, TFEB, NRF2, LAMP1, LAMP2, and HDAC6
Western blot quantification of α-synuclein and phospho-α-synuclein levels in cell lysates ± PAH treatment, demonstrating dose-dependent inclusion reduction.

Western blot pharmacodynamic panel: PAH treatment restores LAMP1, LAMP2, TFEB, and NRF2 protein levels while reducing α-synuclein and phospho-α-synuclein (S129) in dual-hit DA neurons. HDAC6 (aggresome marker) decreases with treatment, confirming dissolution of insoluble aggregates. Multi-readout biomarker validation of lysosomal rescue as therapeutic mechanism. Bayati et al., Nature Neuroscience 2024.

03

Host-Directed Antiviral Strategies

My first-author JBC 2021 paper (Editors' Pick) was the first to demonstrate that SARS-CoV-2 enters cells via clathrin-mediated endocytosis — Spike protein binds ACE2 and is rapidly internalized through CME. Building on this, I contributed to two drug-discovery programs: a PIKfyve chemical probe (IC50 = 0.82 nM) that blocks viral trafficking and replication (J. Med. Chem. 2022), and CSNK2 inhibitors that prevent Spike endocytosis across human, bat, and murine β-coronaviruses (ACS Chem. Biol. 2022). I translated these mechanisms into scalable screening platforms using Spike pseudovirus/GFP quantification on the Opera Phenix HCS system.

Schematic: CSNK2 inhibitor blocking SARS-CoV-2 entry at ACE2 binding, clathrin-mediated endocytosis, replication, and transmission stages
Schematic of SARS-CoV-2 viral entry mechanisms: ACE2 receptor binding, membrane fusion, and intracellular trafficking pathways targeted by CSNK2 and PIKfyve inhibitors.

Mechanism of host-directed antiviral strategy: CSNK2 (Casein Kinase 2) inhibition blocks multiple stages of SARS-CoV-2 lifecycle — from Spike/ACE2 binding and clathrin-mediated endocytic entry, through viral replication, to cell-to-cell transmission. This host-kinase targeting approach provides broad-spectrum activity against β-coronaviruses (SARS-CoV-2, SARS-CoV, MERS-CoV). Published in Yang, Dickmander, Bayati et al., ACS Chemical Biology 2022.

Structure-activity relationship: CSNK2A inhibitor potency (pIC50) vs beta-coronavirus inhibition (pIC50), R-squared 0.68
Confocal imaging showing inhibition of SARS-CoV-2 spike protein internalization by CSNK2 and PIKfyve inhibitor co-treatment vs control.

Structure-activity relationship (SAR) correlation between CSNK2A kinase inhibition potency and antiviral activity against β-coronaviruses. The strong correlation (R² = 0.68) across the pyrazolopyrimidine series validates CSNK2 as the mechanistic target for antiviral activity. 30 inhibitors were profiled using nanoBRET target engagement assays and MIV-nLuc reporter viral assays. Yang, Dickmander, Bayati et al., ACS Chemical Biology 2022.

04

Biomarker Strategy & Translational Execution

I develop and execute target engagement (TE) and pharmacodynamic (PD) biomarker strategies across iPSC-derived neuronal and epithelial systems. This integrates imaging biomarkers (protein aggregation burden, lysosomal stress, mitophagy flux), protein biomarkers (Western blot, ELISA/MSD/Luminex), nucleic acid readouts (RT-qPCR, ddPCR, RNA-seq), and mass spectrometry–guided proteomics from whole-cell and subcellular fractions.

Fig. — Target Engagement / Pharmacodynamic Biomarker Panel
Multi-readout TE/PD panel for Parkin agonist (compound FB231) in iPSC-derived DA neurons — dose-response
72h treatment. Readouts: pUb (phospho-ubiquitin), TOM20 (mitochondrial mass), LC3-II (autophagy), LAMP1 (lysosomal), TH (neuronal health).
Fig. — LC-MS/MS: Compound Quantification
Intracellular and media compound levels over time in iPSC-derived DA neurons
LC-MS/MS quantification of FB231. Calibration range 0.5–500 ng/mL. QC CV < 15%.

I have applied LC-MS/MS workflows for small-molecule PK quantification (including FB231) and used proteomic discovery to prioritize candidate biomarkers, guiding downstream validation with orthogonal assays.

05

High-Content Screening & Hit Discovery

I translated the SARS-CoV-2 cellular entry mechanism into scalable cell-based screening assays using Spike pseudovirus and GFP quantification on Opera Phenix HCS. These platforms enabled hit discovery and validation of viral-entry inhibitors across dose-response and time-course designs in Caco-2, Calu-3, and Vero E6 cells.

SARS-CoV-2 pseudovirus GFP expression: untreated vs inhibitor-treated cells
Fluorescence microscopy of pseudovirus-GFP infection assay in epithelial cells, quantifying viral entry efficiency with and without pharmacological inhibitors.
Lightning tile scan: Spike-His488 and Phalloidin-647 binding across epithelial cell monolayer
High-resolution confocal tile-scan showing SARS-CoV-2 spike protein distribution and cellular uptake patterns across a multi-cell epithelial monolayer.
Fig. — Pseudovirus Entry Inhibition Dose-Response
GFP+ cell percentage in Caco-2 cells treated with PIKfyve and CSNK2 inhibitors — Spike pseudovirus assay
Spike-pseudotyped lentivirus, 48h infection. GFP quantified by Opera Phenix HCS. n=3.
Fig. — CellTiter-Glo Cytotoxicity Panel
Cell viability across 5 cell lines at therapeutic concentrations of PIKfyve inhibitor
CellTiter-Glo luminescence, 72h treatment. Normalized to DMSO. 384-well format.
06

Cytokine Profiling & Inflammatory Signaling

I profile neuroinflammatory cytokine signaling at RNA and protein levels using MSD/Luminex multiplex panels to quantify immune responses and link cytokine stress to aggregation, viability, and biomarker outputs. I also design cytokine-stimulated assay platforms to interrogate TYK2-mediated JAK/STAT signaling and neuroinflammation in iPSC-derived neurons and microglia.

Fig. — Multiplex Cytokine Panel (MSD/Luminex)
Secreted cytokine concentrations from iPSC-derived neuron–microglia co-cultures under stress
MSD V-PLEX panel. Conditioned media collected 48h post-treatment. pg/mL.
Fig. — ISR / ATF4 Pathway Activation
Integrated stress response markers in DA neurons — ATF4/ATF3 protein quantification by Western blot
Western blot densitometry, normalized to β-actin. ATF4/ATF3 axis as pharmacology output for TERT pathway.
07

Senescence, ROS & Mitochondrial Bioenergetics

I evaluate compounds targeting cellular aging by measuring reactive oxygen species (ROS/MitoSOX), senescence markers, and mitochondrial function. Assays include plate-based ROS quantification, mitochondrial membrane potential, and integration with TERT biology to assess long-term cellular fitness under stress conditions.

Fig. — ROS / MitoSOX: Oxidative Stress Quantification
MitoSOX Red fluorescence in DA neurons — mitochondrial superoxide across treatment conditions
MitoSOX Red, plate-reader (BMG FLUOstar Omega). Normalized to Hoechst cell count.
08

Analytical Characterization — HPLC & DLS

I perform orthogonal analytical characterization to support formulation development, compound purity assessment, and nanoparticle quality control. HPLC/UHPLC workflows are used for compound purity, stability monitoring, and retention-time–based identification. Dynamic light scattering (DLS) provides hydrodynamic diameter distributions and polydispersity indices for nanoparticle and EV formulations, supporting batch-to-batch consistency and release criteria.

Fig. — HPLC Chromatogram: Compound Purity Analysis
Reversed-phase HPLC (C18, 254 nm) — FB231 active compound and related impurities
Agilent 1260 Infinity II. Column: Zorbax Eclipse Plus C18 (4.6 × 150 mm, 3.5 μm). Mobile phase: 0.1% TFA in H₂O / ACN gradient. Flow rate 1.0 mL/min. Injection volume 10 μL. Detection at 254 nm.
Fig. — DLS: Nanoparticle Size Distribution
Hydrodynamic diameter of lipid nanoparticles (LNPs) across three independent formulation batches
Malvern Zetasizer Nano ZS. Measurement: 173° backscatter. Temperature: 25°C. Dispersant: PBS pH 7.4. Three independent batches. Mean Z-average and PDI reported per batch.
98.4%
FB231 Purity (HPLC, area%)
78.2 nm
Mean Z-Average Diameter
0.108
Polydispersity Index (PDI)
<2.0%
Total Related Impurities

HPLC purity profiling is performed during compound synthesis QC and at defined stability timepoints (T0, 1-week, 4-week, accelerated). DLS is integrated into the formulation pipeline for LNP and microsphere preparations, guiding size optimization for target tissue delivery. Batch-to-batch reproducibility is assessed through overlaid intensity-weighted distributions and Z-average trending.