ESC
In Vivo Neuroscience

Ischemic Stroke & Ultrastructural Analysis

Investigation of neuronal and glial cell structure in the peri-infarct zone following photothrombotic stroke in adult mice. Combining toluidine blue histology with transmission electron microscopy to characterize ultrastructural changes at the synapse, astrocyte, and mitochondrial level.

Photothrombotic Stroke Perfusion Fixation Vibratome Sectioning Toluidine Blue Spurr's Resin Embedding Transmission EM Ultramicrotomy Morphometric Analysis Pseudocoloring ImageJ Analysis
01

Photothrombotic Stroke Model

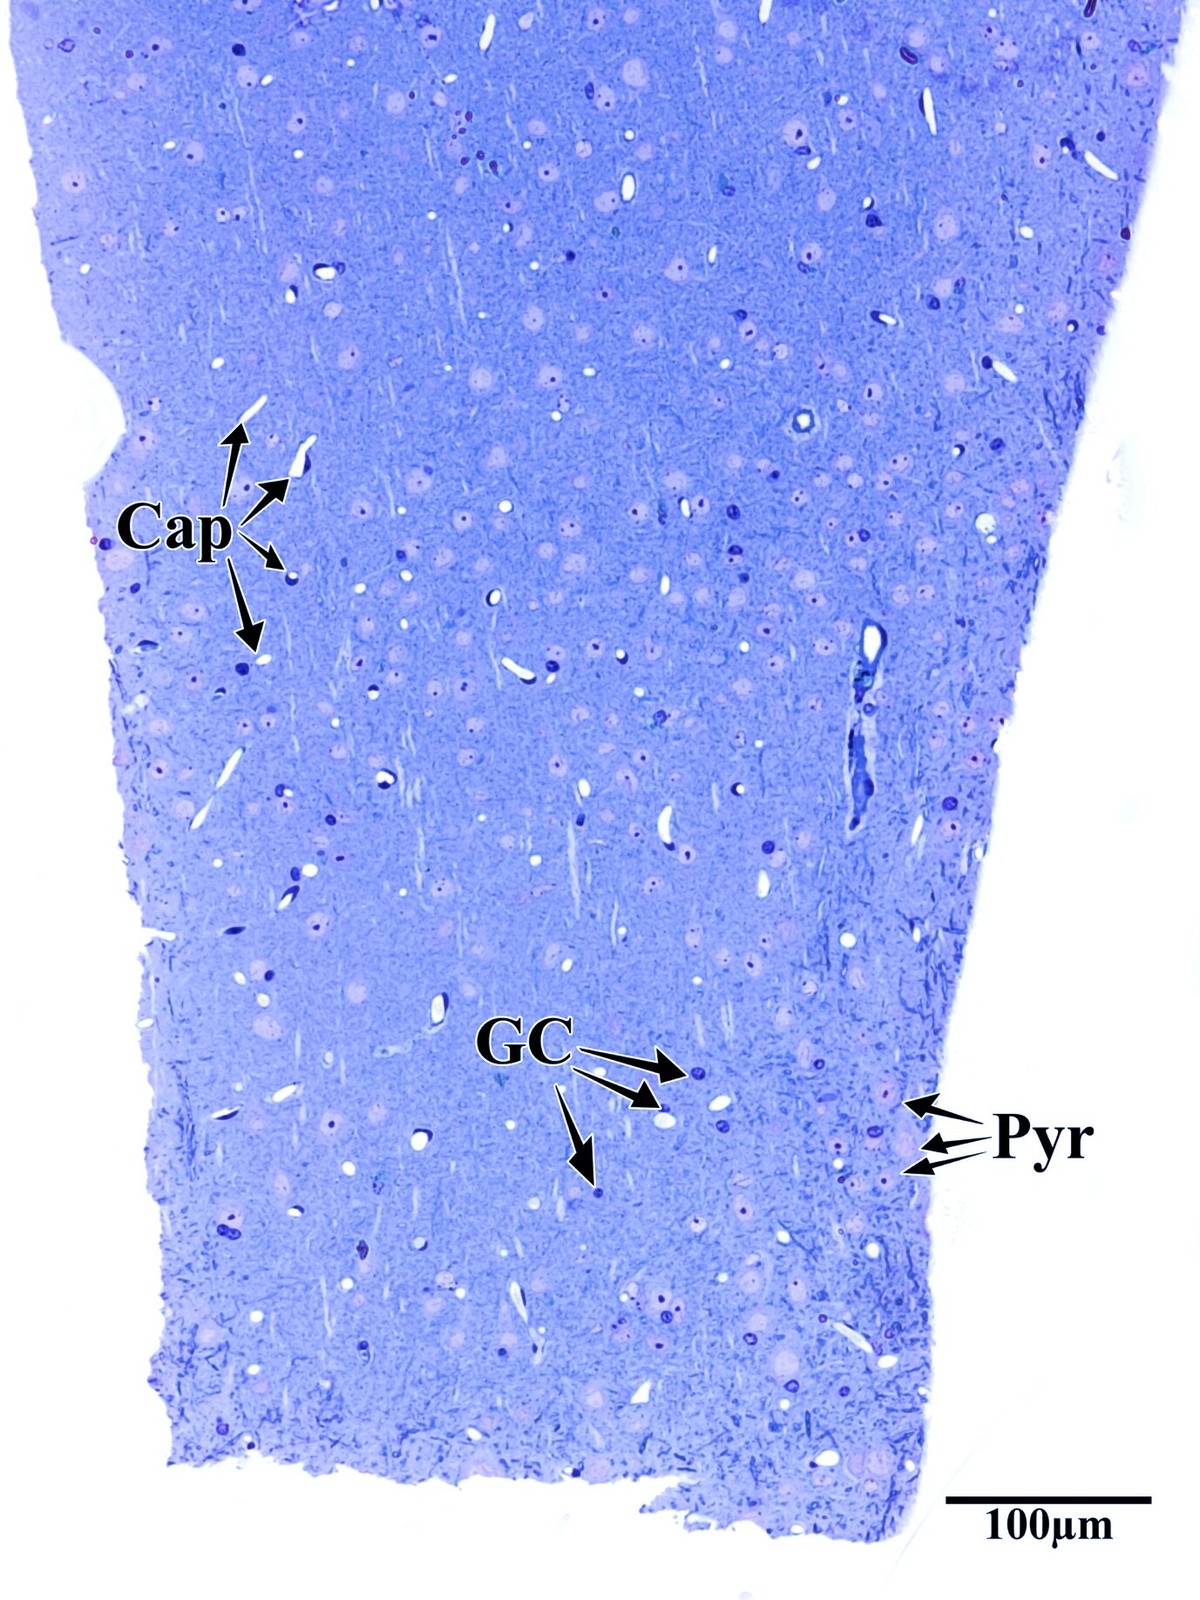
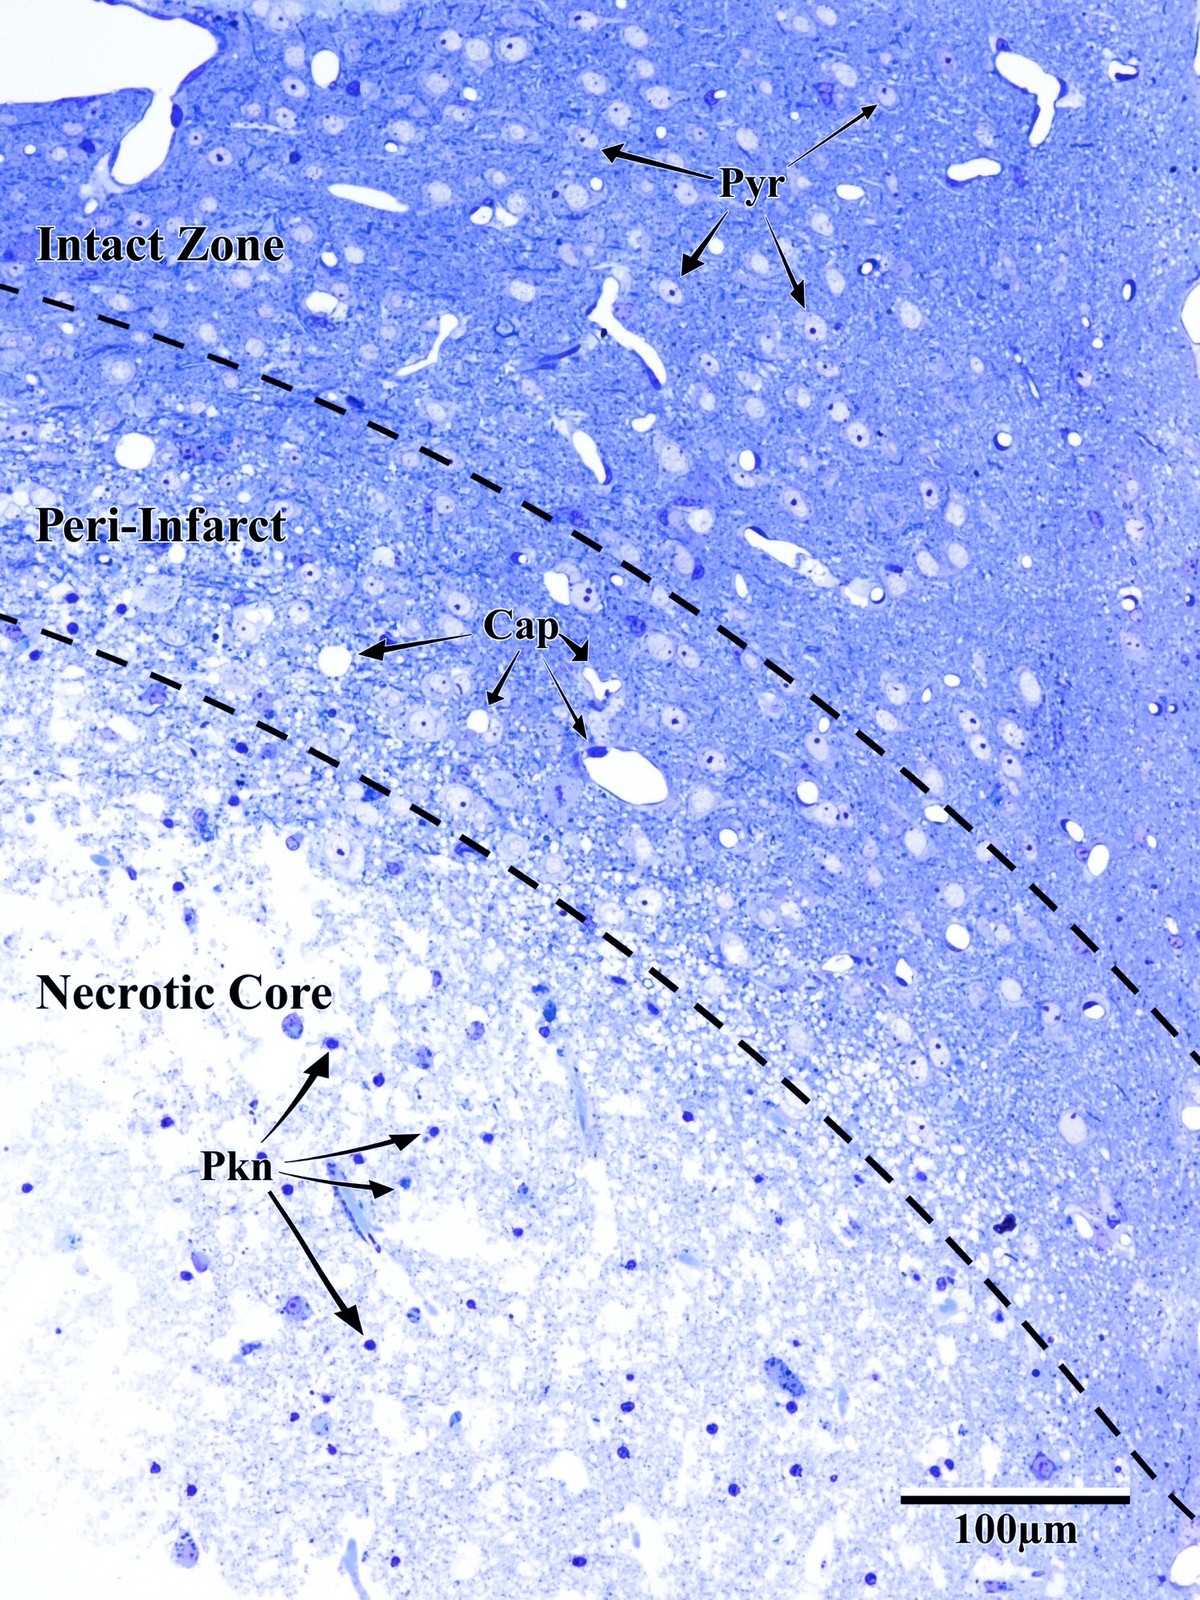
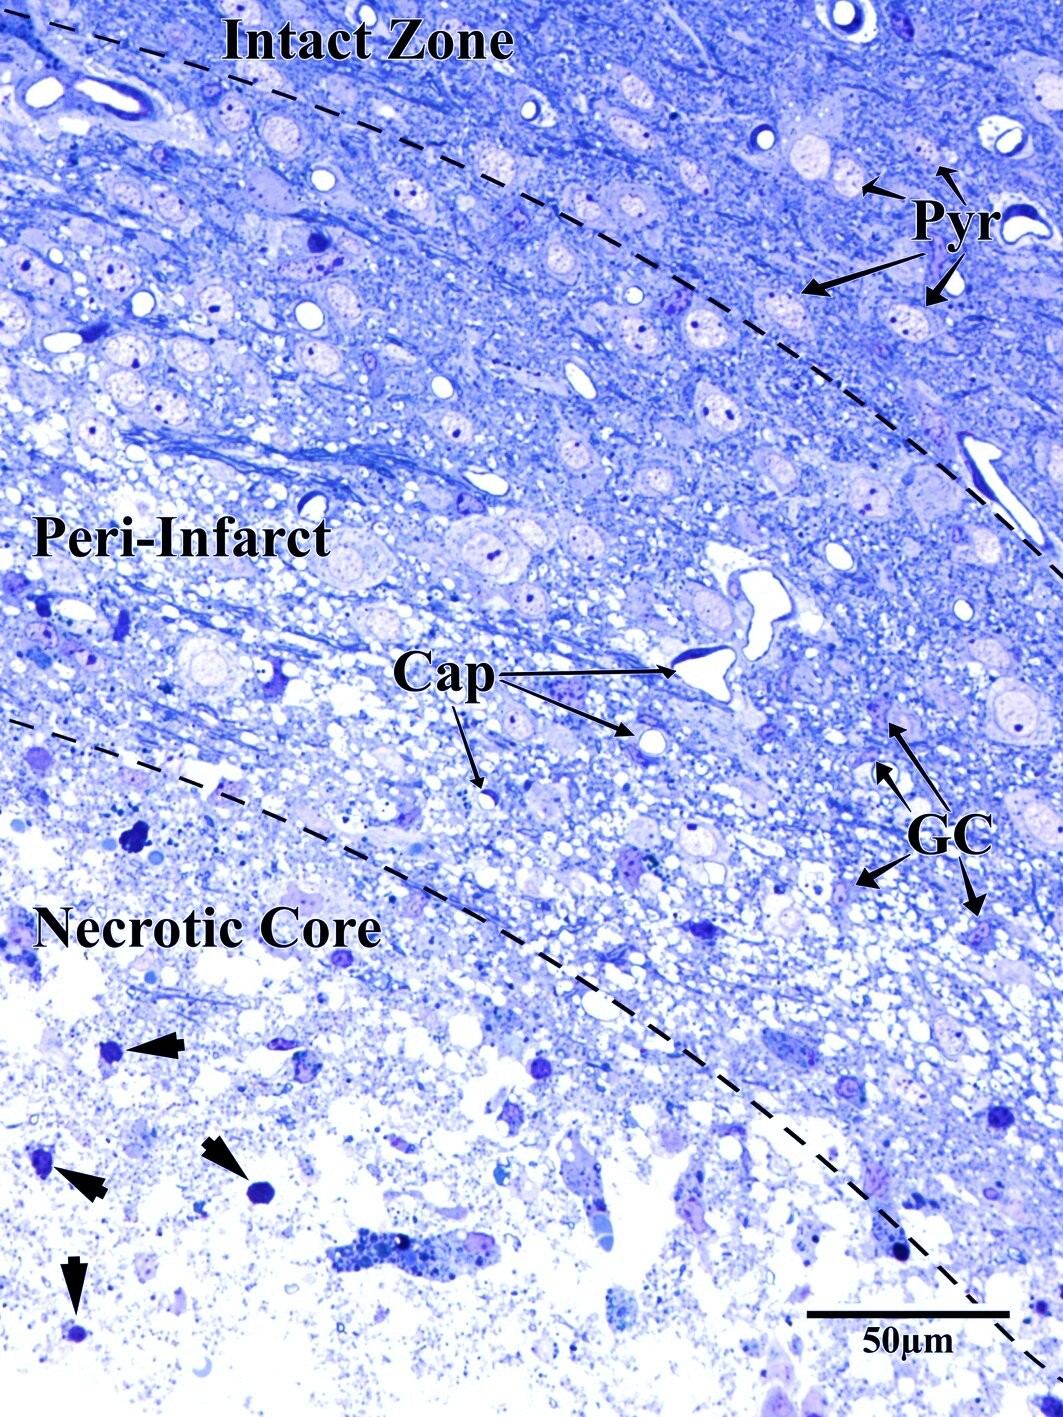
Focal unilateral stroke was induced in the somatosensory cortex (SSC) corresponding to the forelimb representation in adult mice (3 and 18 months, n = 5). Rose Bengal (110 mg/kg, IP) was administered as a photosensitizing agent, followed by targeted illumination with a green laser (532 nm, 17 mW, 15 min) through a thinned skull window. No craniotomy was needed — the skull was thinned to ~50% thickness with a dental drill under stereotaxic guidance.

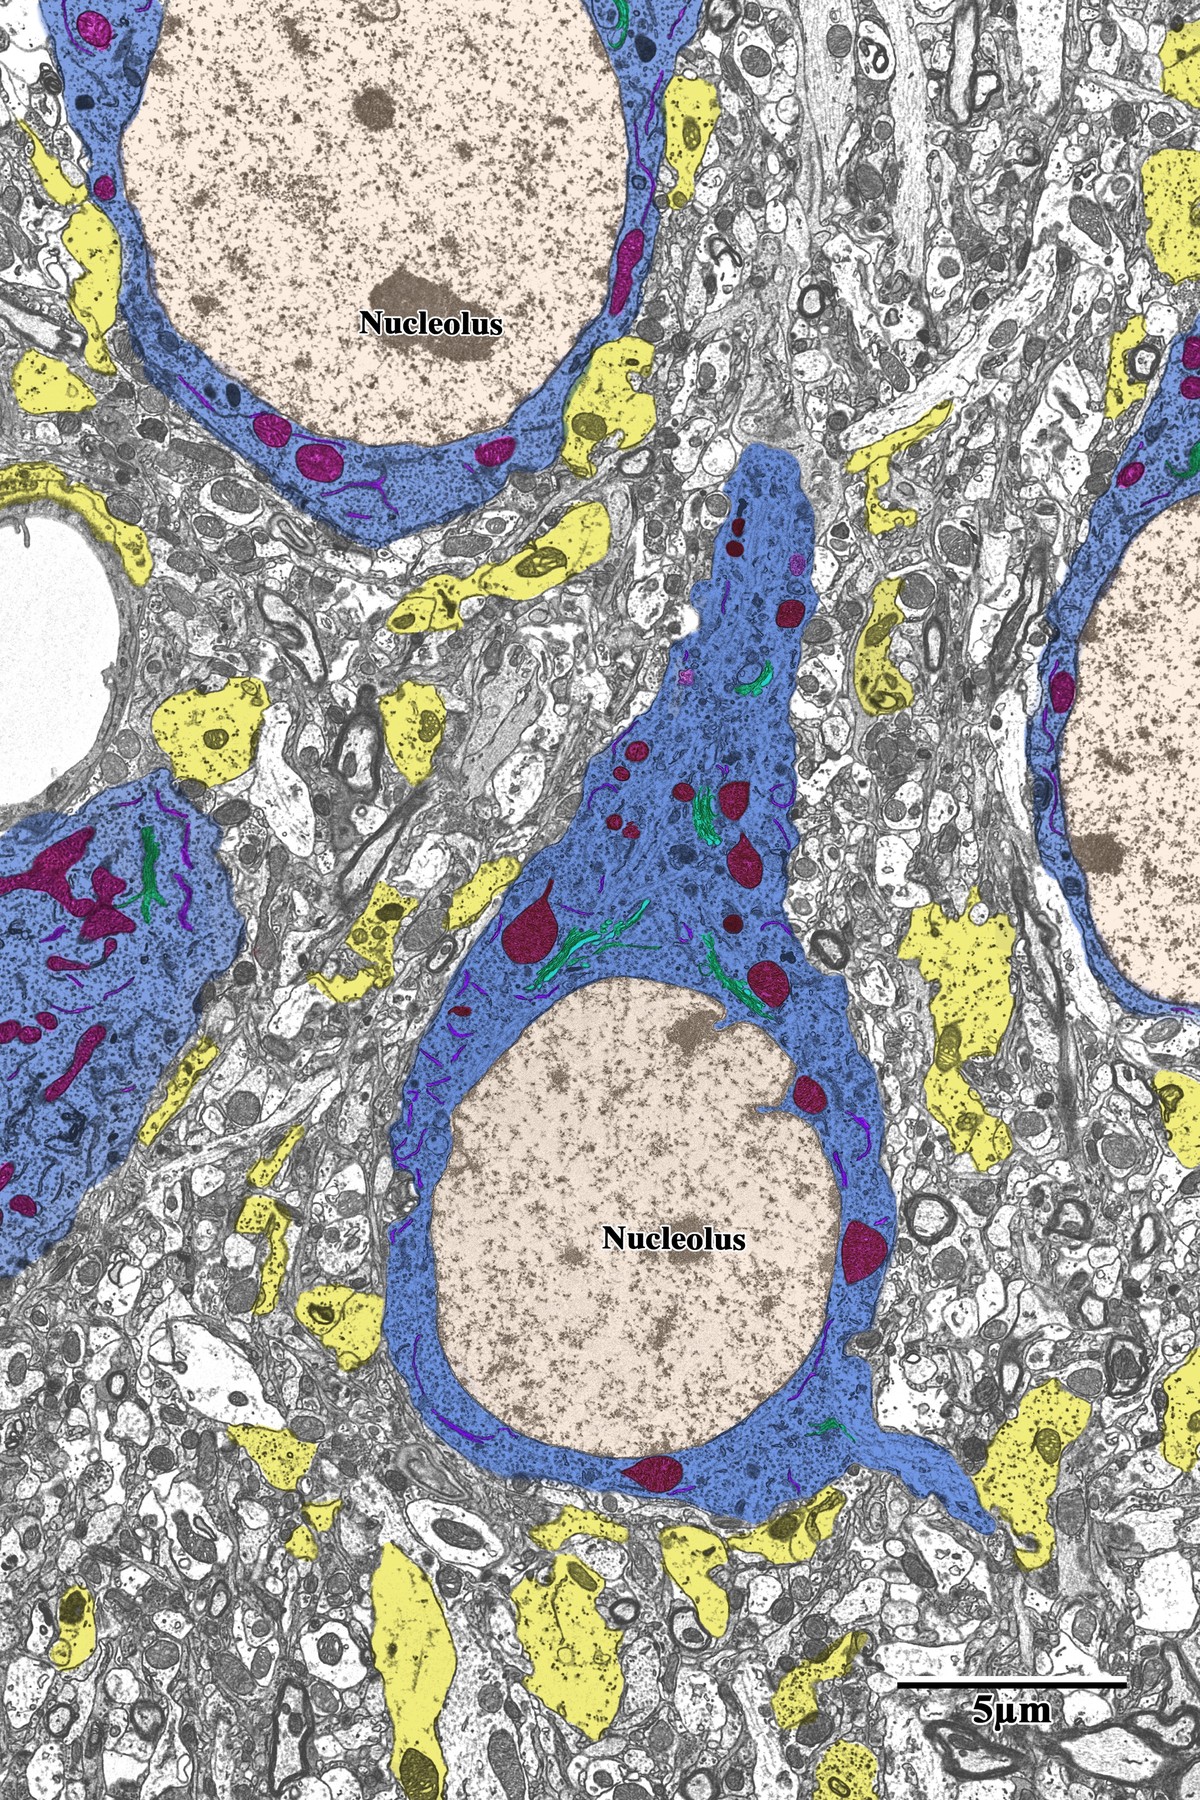
Following 72 hours of recovery, mice were deeply anesthetized and prepared for transcardial perfusion fixation to preserve ultrastructure for both light and electron microscopy.

532 nm
Green laser wavelength
15 min
Illumination duration
72 h
Recovery period
n = 5
Adult mice (C57BL/6)
Anesthesia 1.5% Isoflurane Stereotaxic frame Skull Thinning Dental drill 50% thickness Rose Bengal 110 mg/kg IP Photosensitizer Green Laser 532 nm, 17 mW 15 min illumination Recovery 72 hours Post-stroke Perfusion Fixation 2% Glut + 2% PFA Cacodylate buffer T = 0 T + 72h FIXATION
02

Perfusion, Fixation & Embedding

Transcardial perfusion with heparinized PBS (5 min) followed by 2% glutaraldehyde + 2% paraformaldehyde in 0.15M cacodylate buffer. Post-fixation in 1% OsO₄-potassium ferrocyanide (2 h), en bloc uranyl acetate staining (2 h), ascending ethanol dehydration (50–100%), and infiltration with Spurr's resin. Tissue embedded in BEEM capsules at 60 °C for 48 h.

Coronal sections (200 µm) cut on a Leica VT1000S vibratome. Under stereomicroscope, 1 mm² tissue blocks microdissected from the peri-infarct zone and contralateral control hemisphere.

PERFUSION & FIXATION PBS Flush 5 min, heparinized Glut + PFA (2%) Cacodylate buffer OsO₄ + Ferrocyanide 2 hours post-fix Uranyl Acetate En bloc, 2 hours DEHYDRATION & EMBEDDING 50% EtOH 70% EtOH 90% EtOH 100% EtOH Spurr's Resin Infiltration BEEM Capsule 60 °C, 48 h cure
200 µm
Vibratome section thickness
1 mm²
Microdissected block
0.5 µm
Semithin (toluidine blue)
70–80 nm
Ultrathin (TEM)
03

Toluidine Blue Light Microscopy

Semithin sections (~0.5 µm) were cut with glass knives on a Reichert-Jung UltraCut E ultramicrotome, stained with toluidine blue, and imaged on an Olympus BX51 light microscope with a DP73 camera at 4800 × 3600 px resolution. These sections served as orientation for subsequent ultrathin sectioning and quality control.

Cortical Layer Architecture

Toluidine blue staining reveals the full laminar architecture of the adult mouse somatosensory cortex (layers 1–6). Capillaries (Cap), pyramidal neurons (Pyr), and glial cells (GC) are readily identified in the control hemisphere.

Toluidine blue stained layers 1-6 of adult mouse somatosensory cortex
Toluidine blue light micrograph showing cortical layers 1–6 of the adult mouse SSC. Capillaries (Cap), pyramidal neurons (Pyr), and glial cells (GC) annotated. Semithin section (0.5 µm). From Bayati, BSc Honours Thesis 2018.
Ischemic Tissue Zones

The photothrombotic lesion creates three distinct zones visible at low magnification: the intact zone (normal cytoarchitecture), the peri-infarct zone (PI — compromised but recoverable tissue), and the necrotic core (complete tissue destruction with pyknotic nuclei).

Toluidine blue section showing intact zone, peri-infarct, and necrotic core
Ischemic tissue showing the three zones: intact zone with normal pyramidal neurons (Pyr), peri-infarct zone with reduced capillary density (Cap), and necrotic core with pyknotic nuclei (Pkn). Dashed lines indicate zone boundaries. From Bayati, BSc Honours Thesis 2018.
Peri-Infarct Zone Detail

Higher magnification of the ischemic border region reveals the gradual transition from intact tissue to necrotic core. Within the peri-infarct zone, there is a progressive loss of recognizable capillaries, decreased concentration of pyramidal neurons, and compromised blood-brain barrier morphology evidenced by perivascular vacuoles.

High magnification toluidine blue showing peri-infarct zone detail
Higher magnification view of the three regions near the necrotic focal point. The peri-infarct zone shows compromised cellular ultrastructure while maintaining overall morphological integrity compared to the necrotic core. From Bayati, BSc Honours Thesis 2018.
04

Transmission Electron Microscopy

Ultrathin sections (70–80 nm) were cut with a Diatome diamond knife on the UltraCut E, collected on 200-hex copper mesh grids, and imaged at 80 kV on a JEOL JEM-1400 TEM equipped with a Gatan Orius SC1000 CCD camera (4008 × 2672 px). Key subcellular structures were pseudocolored in Adobe Photoshop to enhance visualization and enable morphometric quantification in ImageJ.

Pseudocolored Ultrastructure Overview

Low-magnification pseudocolored EM panorama showing the neuropil of the contralateral (control) SSC. Pyramidal neurons (blue) display characteristic round morphology with prominent nucleoli, surrounded by astrocytic processes (yellow) and mitochondria (red). Synaptic contacts with pre- and post-synaptic elements visible throughout the neuropil.

Pseudocolored TEM overview showing neurons (blue), astrocytes (yellow), mitochondria (red)
Pseudocolored TEM panorama of control SSC neuropil. Pyramidal neurons (blue), astrocytic processes (yellow), mitochondria (red), pre-synaptic terminals (green). From Bayati, BSc Honours Thesis 2018.
Synaptic Classification

Synapses were classified and pseudocolored for morphometric analysis. Presynaptic terminals (green) contain synaptic vesicles and interface with postsynaptic structures (blue). The dendrite shown here features multiple synaptic contacts including both excitatory (round vesicles, large PSD) and inhibitory (flattened vesicles) types.

Pseudocolored pyramidal neuron dendrite with synaptic contacts
Pyramidal neuron dendrite (blue) with associated mitochondria (pink/red) and synaptic contacts (green presynaptic terminals). From Bayati, BSc Honours Thesis 2018.
Control Pyramidal Neurons

In the contralateral (uninjured) hemisphere, pyramidal neurons display round, electron-lucent morphology with intact nuclear envelopes, prominent nucleoli, and well-organized cytoplasmic organelles. Astrocytes (wavy arrows) occupy relatively limited space in the surrounding neuropil.

Control pyramidal neurons with healthy round morphology in contralateral SSC
Pyramidal neurons (blue) within the contralateral SSC exhibiting round morphology with intact cellular processes (arrows) and healthy astrocytes (wavy arrows). From Bayati, BSc Honours Thesis 2018.
Peri-Infarct Neuronal Degeneration

Progressive neuronal degeneration is observed with increasing proximity to the infarct core. Distal PI neurons show early cytoplasmic darkening with partial organellar preservation and microglia encroachment. Proximal PI neurons display advanced degeneration — swollen mitochondria, disrupted endoplasmic reticulum, and vacuolization of the surrounding neuropil.

Distal peri-infarct neuron showing early ischemic changes with microglia
Distal peri-infarct zone: neurons (blue) showing early ischemic changes with microglia encroachment (labeled). Note the reduced dendritic complexity compared to control tissue. From Bayati, BSc Honours Thesis 2018.
Proximal peri-infarct neuron showing advanced degeneration
Proximal peri-infarct zone: advanced neuronal degeneration (blue) with extensive neuropil vacuolization, swollen mitochondria, and near-complete loss of surrounding synaptic contacts. From Bayati, BSc Honours Thesis 2018.
Necrotic Core & Infarct Zone

Within the necrotic core, neurons show complete loss of organellar integrity — barren dendritic processes, no identifiable synapses, and pyknotic glial cell nuclei. This zone is characterized by widespread degenerating neuropil tissue and the complete absence of functional synaptic structures.

Degenerating neuron and pyknotic glial cell in the necrotic core
Necrotic core: degenerating neuron (blue) and pyknotic glial cell (arrow) surrounded by disintegrating neuropil. No identifiable synapses were observed within this region. Scale bar: 5 µm. From Bayati, BSc Honours Thesis 2018.
05

Astrocytic Inflammation & Mitochondrial Changes

Astrocytes responded dramatically to ischemic injury, showing increased process area and reactive morphology in the peri-infarct zone. Astrocytic processes were traced and pseudocolored yellow for quantification, revealing glycogen granule accumulation, swollen mitochondria, and extensive perivascular endfeet coverage around capillaries.

Reactive Astrocytosis
Pseudocolored astrocytes (yellow) surrounding neurons (blue) in peri-infarct zone
Peri-infarct zone: reactive astrocytes (yellow) surrounding pyramidal neurons (blue). Note the dramatically increased astrocytic coverage compared to control tissue, with microglia also visible. From Bayati, BSc Honours Thesis 2018.
Astrocytic endfeet around capillary with microglia
Astrocytic endfeet (yellow) surrounding a capillary in the peri-infarct zone. Lighter mitochondria (arrows) and glycogen granules (arrowheads) are identifying features. Microglia visible in close proximity, suggesting active inflammation. From Bayati, BSc Honours Thesis 2018.
Pre- & Post-Synaptic Structures
Pseudocolored pre-synaptic (green) and post-synaptic (blue) structures
Pseudocolored EM showing presynaptic terminals (green) and postsynaptic structures (blue) within a control neuropil test field. Scale bar: 1 µm. From Bayati, BSc Honours Thesis 2018.
06

Morphometric Quantification

Over 600 synapses were identified and counted across 50 test fields (6.58 × 4.39 µm each) at 30,000× magnification. Subcellular structures were traced in Adobe Photoshop and quantified via thresholding in ImageJ. Contralateral hemisphere served as paired control for each animal (n = 5).

600+
Synapses identified
50
Test fields analyzed
30,000×
TEM magnification
Synaptic Density
Mean synapse count per test field — contralateral vs. peri-infarct (p < 0.0001)
Astrocytic Area
Mean astrocytic area per test field — µm² (p = 0.0004)
Postsynaptic Density Area
Mean PSD area per test field — µm² (p = 0.014)
Mitochondrial Area
Mean mitochondrial area per test field — µm² (p = 0.088)